Data without context doesn’t tell you much.
If you had a spreadsheet that shows the hours tracked by teams and the apps they use most, it would still mostly be noise unless someone performs the difficult task of making sense of it. With workforce intelligence software, no one has to. Here’s how Hubstaff turns time data into analytics.
Capturing operational data
Every workforce intelligence system starts in the same place: raw operational data.
Before any pattern or forecast can exist, the software needs a clean record of what's really happening every day.
- Time entries. Hours tracked to specific tasks, clients, and projects by the people doing the work.
- Activity signals. App usage, URLs visited, and idle time that show how team members are spending their time.
- Project and task context. The work items and deliverables connected to the hours and activity tracked by team members.
Even on their own, these data points are valuable. They enable a manager to see who's tracking time to which tasks, which apps get the most use, and which projects are consuming the most resources.
For instance, BPO teams juggling dozens of client accounts can see exactly how many hours each client is pulling, down to the task level, instead of estimating it at invoice time. That said, raw data doesn't explain why any of it is happening, and it doesn't tell you what to do next.
Analyzing patterns with AI
When it comes to identifying trends and patterns, the efficiency of AI is hard to beat. AI can process large amounts of data with extremely high accuracy.
That means decision-makers get more time for work that moves the needle, instead of squinting at spreadsheets for hours on end.
Here's what AI-supported analysis enables:
- Benchmarking. Comparing performance across roles, teams, or time periods, so no single number gets judged out of context.
- Anomaly detection. Flagging unusual activity or sudden drops in output before they turn into bigger problems.
- Utilization trends. Tracking how much of a team's time goes toward billable work, project work, or idle time over weeks and months.
Visibility into patterns like these effectively eliminates guesswork. You'll know if a workflow is breaking down before it makes a serious impact on the team. Using the same BPO example above, benchmarking can show if one client team is consistently taking longer to hit its targets than others performing similar work, a pattern no single time entry can reveal on its own.
And once problems have been brought into the spotlight, the next step is to fix them.
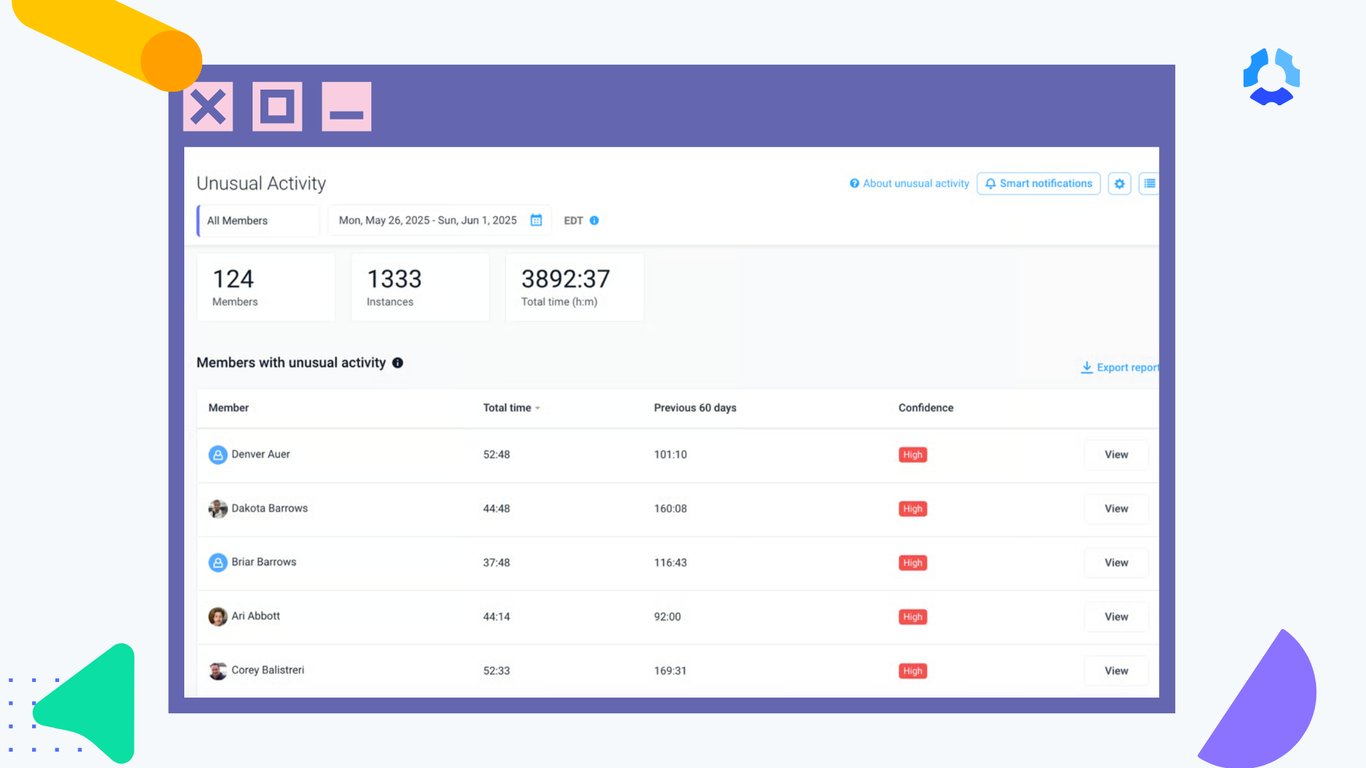
Turning insights into action
Patterns and benchmarks are turned into dashboards and alerts. With these at their hands, managers are in a strong position to take action based on what the data tells them. For instance, managers can:
- Adjust staffing based on real utilization numbers instead of a guess.
- Rebalance workload before one team member carrying too much turns into burnout or a missed deadline.
- Change a process that's clearly slowing a team down, instead of waiting for the quarterly review to notice.
Going back to the BPO example: on their own, that client team's utilization rates look healthy. Everyone's busy and logging solid hours. But benchmarked against other teams handling similar accounts, workforce intelligence shows that the team is carrying significantly more per-person workload because the account is understaffed.
Utilization alone would have missed it, but together with the benchmarks, the imbalance was revealed. Now, the manager can shift someone onto that account before it shows up as a missed SLA.
Data, at its highest form, informs decisions. Instead of reacting to problems as they appear, managers can deal with them while they can still change the outcome.