Man working on laptop outdoors with productivity tracker showing 78% activity.
Guide

Idle Time vs. Unproductive Time: What's the Difference?

G2 logo
G2 Leader Summer 2026
No credit card required

Idle time is a misunderstood metric.

Here's an example: suppose a manager sees an 80% activity day and a 20% activity day. They can't tell for sure which one reflects real work, but the default assumption is that the 20% activity day means less got done than the 80% day.

Activity metrics back that up too, since they'll show significantly more idle time on the 20% day. That doesn't mean it was unproductive time, though. Several factors determine what makes time spent on work productive or unproductive:

  • Activity
  • Idle time
  • Focus time
  • Output
  • Core vs. non-core work

And in this article, you’ll learn how to read and interpret productivity monitoring data so you can tell what’s really happening in your team, regardless of the activity scores you’re seeing.

What is idle time?

Idle time is a categorization of time tracking data in which a user does not interact with a keyboard or mouse while a time tracker is running.

In most cases, idle time reflects legitimate work such as:

  • Reviewing materials
  • Sitting in a meeting
  • Performing research
  • Reading documentation

These tasks don't result in high activity scores the way coding or data entry does, but they're just as important inside an organization. That's why zero idle time isn't realistic and shouldn't be an expectation on any team.

Over time, you'll get a baseline for how much idle time looks normal for each person on your team. Only when it deviates from their own baseline, conflicts with their role, or lines up with a drop in deliverables should idle time be investigated.

idle time vs. unproductive time-1.png

How Hubstaff calculates idle time

Hubstaff checks blocks of time for any keyboard or mouse interaction. You can set these blocks to be 5, 10, or 20 minutes long.

If there's no keyboard or mouse interaction during that block, Hubstaff registers it as idle time.

For example, say someone on your team starts reading a PDF at 10:00 AM and reads it for 12 minutes straight. At 10:12, when they finally move their mouse or press a key, Hubstaff notifies them they've been idle for 12 minutes.

From there, they can either discard that idle time or keep itβ€”labeled as idle timeβ€”on their timesheet.

What is unproductive time?

Unproductive time is very different from idle time.

With idle time, there's still a good chance the person is performing work. With unproductive time, the person is active (i.e., they're typing on their keyboard, clicking their mouse, using apps, and browsing websites) but none of that activity is tied to their role's core work.

The challenge in tracking unproductive time is that different roles have different sets of productive and unproductive activities. For instance:

  • A marketer spending time on social media channels would typically look like an unproductive activity. But if they're researching trends and audiences, that same activity supports the role and shouldn't count as unproductive time.

  • A video editor on your team will naturally spend a lot of time on platforms like YouTube or TikTok. If a tool applied one universal list of productive and unproductive apps to every role, that video editor would look like one of the most unproductive people on the team.

  • A recruiter spending hours on LinkedIn looks unproductive by a generic app list, but for their role, it's core work.

This is why Hubstaff’s activity tracking software was built with role-aware, contextual classification of apps and URLs, instead of one fixed list of productive apps applied to every role.

Idle time vs. unproductive time at a glance

To help you visualize how idle time differs from unproductive time, below is a table that shows what each measures, the common causes for each, and whether or not you should be concerned.

MetricWhat It MeasuresCommon CauseShould You Be Concerned?

Idle Time

No device interaction detected

Meetings, reading, breaks, thinking time

Only if it deviates from baseline or deliverables drop

Unproductive Time

Device interaction detected on non-core tasks

Personal browsing, off-task apps

Only if it becomes a pattern, not a one-off

While this table isn't an exhaustive list of all the activities that could be performed in any organization, it's a good starting point if you're looking at instances of idle time right now and trying to decide whether that idle time contributed to the role or not.

How activity level fits in

Hubstaff’s activity tracking software calculates percentages based on 10-minute blocks:

Active seconds Γ· 600 = Activity %

Activity level isn't an absolute productivity score. It's a signal, and like most employee productivity metrics, it works best when read as a trend.

The activity percentage formula

Using the formula above, here are two examples:

  • Person A is a programmer who spent 400 out of 600 seconds in a block writing code, giving them an activity percentage of ~67% for that block.

  • Person B is an account executive who spends a lot of time on calls and only interacts with their keyboard to take notes. They were active for 60 out of 600 seconds, giving them an activity percentage of ~10%.

These metrics aren't designed for comparing one person to another. In the example above, it wouldn't be fair to compare Person A's activity score to Person B's, because there are too many variables. They could be in different roles, on different teams, or handling different clients.

This is why activity percentages should be compared against that same person's own activity percentages. It should be used to define what normal looks like for them, so that over time, if they deviate, you have a reference point and know something caused that.
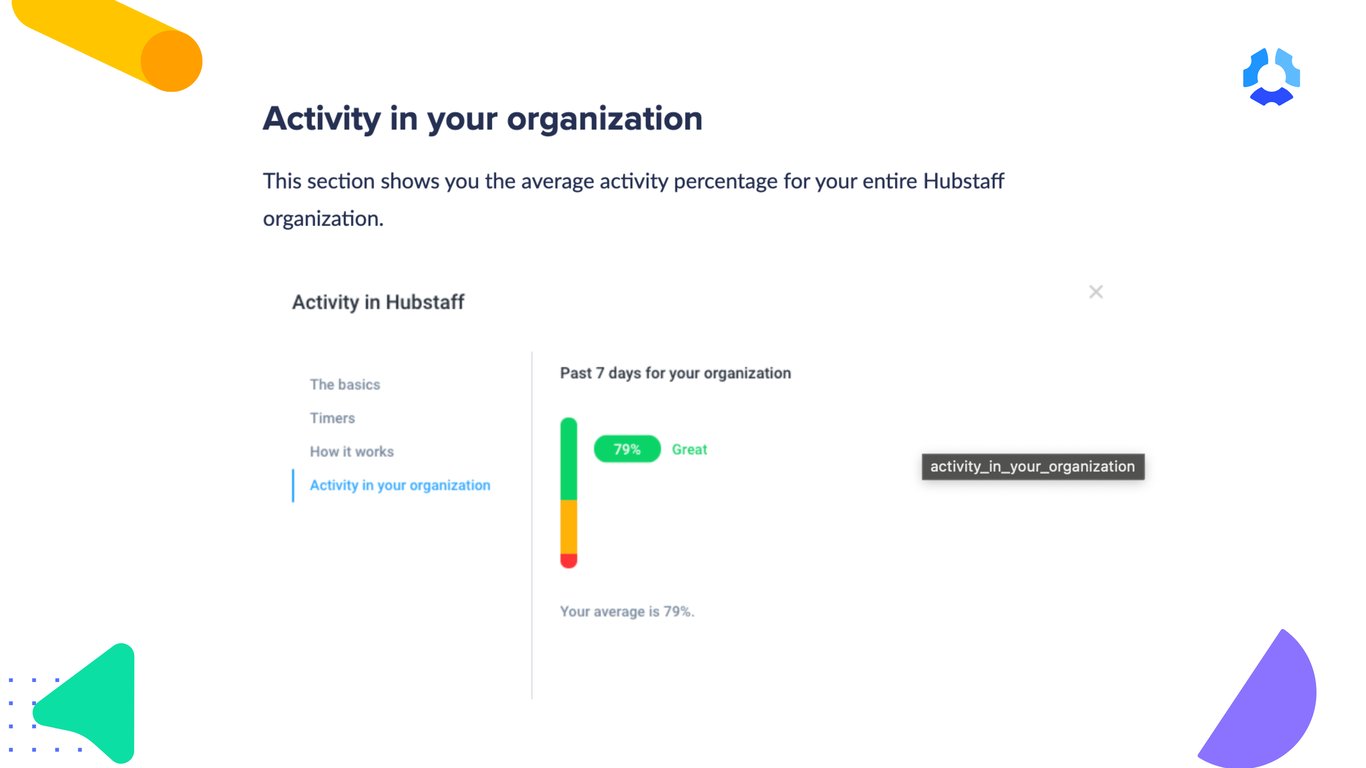
idle-time-vs-unproductive-timepng.png

Healthy activity ranges by work type

Over the years, we've heard from Hubstaff users who are concerned that their team isn't β€œproductive” enough because of low activity scores.

Because of the way activity scores are calculated, we always recommend that leaders and managers not set a specific activity score and ask employees to meet it or be labeled as unproductive.

While that may seem like a harmless expectation, it changes the definition of success in that role from good output to the appearance of being busy.

Based on our own data, here are healthy activity ranges you can use as a baseline:

  • 20–40%: Meeting-heavy days
  • 40–60%: A normal, full working day
  • 60–80%: Focused execution tasks
  • 90%+ or under 20%: Uncommon, worth a closer look, but not an automatic flag

The best way to use these numbers is to compare a person to their own historical productivity benchmarks and to peers doing similar work inside your organization. Once you've identified that baseline, you'll notice when someone steps outside of it. That’s when you should consider looking into it.

Regardless of department or role, what you can look out for is sustained scores above 90% or under 20%.

These numbers are absolutely possible for short periods of time. A short stretch above 90% might mean someone put in a lot of work in a crunch, but that's not sustainable over a long period.

The same goes for the other extreme; a short stretch at 20% could easily mean someone got stuck or is processing information. But if they stay there for a long time, it might signal something like burnout or the person struggling with their role.

Focus time and output: What activity percentage misses

Focus time is one of Hubstaff's important metrics, and it's distinct from activity percentage. Where activity percentage is based on keyboard and mouse input, focus time measures the amount of time a person spends in deep, uninterrupted work. A person can have a low activity percentage but a healthy level of focus time.

To get a fair and accurate understanding of how someone spent their time, you need to look at their output. That should be the basis of their performance, not their interaction with their device.

idle-time-vs-unproductive-time.png


Focus time vs. activity level

Activity level reflects device interaction. Focus time reflects sustained, uninterrupted work blocks. Someone can have high focus time and a comparatively lower raw activity percentage.

For example, let's say a person spent two hours in a strategy session, and they were using Hubstaff Insights throughout the day.

During that time, there was minimal interaction with their device, but a lot of interaction with their teammates moving the agenda forward. Low activity might suggest low output, but that wouldn't be the case here, because they were focused the entire time. Focus time deserves to be one of your team's top productivity metrics for exactly this reason.

Why output matters more than input

It's easy to misconstrue activity data as output because it shows you how team members did the work.

But that's exactly what it is: an input.

It shows you what was happening while a team member was working, but there's no way for it to show you whether the job was done well or whether the outcomes they were producing are on track.


InputsOutputs
  • Apps and websites visited
  • Keyboard and mouse activity
  • Idle time
  • Focus time
  • Tasks completed
  • Deliverables submitted
  • Deadlines met
  • Quality of work produced

You should never prioritize the input when you're trying to understand how well the work was done.

Instead, work backwards: start from the output and deliverables, and determine if the job was done well or not. Then, you can go back to the inputs to understand if there's anything you could be doing better to make work easier for them, or if there's anything preventing their success.

This approach supports the weekly-review habit that will help you turn metrics like these into actionable steps with your team, which we’ll discuss later.

Core work vs. non-core work: Why context changes everything

Productive work falls into one of two categories: core work and non-core work.

Core work is tasks and deliverables central to a person's role in an organization. It's their primary output.

idle-time-vs-unproductive-time-4.png

Non-core work, on the other hand, is tasks that may not lead to the primary deliverables expected of a person's role. They are nonetheless necessary, because they make core work possible.

Here are some examples of core and non-core work across different roles:

RoleCore WorkNon-Core Work

Developer

Writing and shipping code, fixing bugs

Attending standups, filling out timesheets

Account Executive

Making sales calls, closing deals

Updating the CRM, internal sales meetings

Marketer

Running campaigns, writing content

Reporting on metrics, cross-team syncs

Activity and idle time patterns apply differently depending on which type of work you're looking at.

You can infer that an account executive will have low activity percentages as they perform their core work. But if you think about what that work entails (e.g., calls, conversations, relationship building), low activity makes perfect sense.

Now, compare that to a developer or a data entry specialist. If you saw a developer with low activity scores and more than a few instances of idle time during their core work, without any context, that would look really bad.

That's exactly why you should compare people to their own baseline and to peers in similar roles, never to people in unrelated roles or departments.

Understanding the difference between productivity and efficiency is part of getting workforce productivity metrics right. They only mean something when you're reading them in context.

How to read these metrics together

Hubstaff is a very powerful tool, but we'll be the first to admit it's easy to get overwhelmed. There's so much information available that it's hard to know where to start or what actually matters. Here's an easy, repeatable five-step process you can run every week to better understand what's happening on your team:

  1. Scan for unusual activity patterns before anything else. This gives you a quick sense of whether anything needs a closer look before you dig into the details.

  2. Check the Performance page for utilization, work-time classification, focus time, and activity together, never activity alone. Looking at one metric in isolation will give you an incomplete picture.

  3. Look at trends over time, not a single day's snapshot. One low-activity day means very little on its own. A pattern over weeks is exponentially more informative and valuable.

  4. Cross-reference the data against actual deliverables and outcomes. The numbers should only matter in relation to what got done.

  5. Only dig into detail views, like screenshots, if something still looks inconsistent after the steps above. This should be the exception, not where you start.

This workflow takes about five minutes and turns raw metrics into a coaching conversation that can make a significant positive impact on each team member, instead of a scorecard.

What we want readers to do next

By now, you should be able to explain the difference between idle time and unproductive time to your own team. You should be able to look at the activity data of different team members and discern which is which.

Your next step is to stop treating activity percentage as a standalone productivity score. It's a supporting metric, and it shouldn't supersede the output.

Before drawing conclusions from any single metric, run the five-step weekly review we covered in the earlier section. You can find the workforce analytics data that you need to easily run this review process on the Performance page in Hubstaff Insights.

The bottom line

Activity, idle time, focus time, core work, and output all measure something different. You won't be able to tell the whole story if you look at these productivity metrics in isolation.

Put them together, and you'll have a clear understanding of how work happens on your team every day. Then, use that data to start meaningful conversations with your team members, ones that lead to real growth and better performance.

Use productivity metrics to coach your team

Add context to productivity metrics and make informed performance evaluations.