Productivity Metrics Examples in the Workplace for 2025
- Tracking raw hours tells you little without context — pairing time data with output, quality, and efficiency metrics gives a complete picture of what's actually driving business results.
- Quality metrics are the most honest productivity indicators; a team producing less but achieving 30% higher conversion rates through better research delivers more real value than one chasing volume.
- Every productivity metric should map to a specific business goal — without that connection, even well-intentioned tracking becomes a vanity exercise that misleads rather than improves performance.
A new year means a renewed pursuit of productivity — but are you looking at the right data? We’ve compiled a list of the best productivity metrics examples to help you measure productivity for real, tangible results.
You may be inclined to push your team to rack up more raw hours in 2025. But are sheer hours directly correlated to productivity, or will efficiency plummet when your team inevitably plateaus?
In industries ranging from software engineers to sales teams (particularly in remote settings), tracking metrics helps leaders pinpoint strengths and eliminate bottlenecks. We’ll explore real employee productivity metrics like task completion rates, broader Key Performance Indicators (KPIs), and everything in between.
Let’s get started.
Stay in the loop
Subscribe to our blog for the latest remote work insights and productivity tips.
The importance of measuring productivity
We all feel measuring productivity is crucial, but how many of us are doing it correctly? Productivity is about achieving and measuring desired outcomes — not reaching arbitrary thresholds like total hours worked or max employee activity score.
When you measure productivity correctly, you unlock several benefits. For instance, you can:
- Identify strengths and areas for improvement. Quantitative measures like tasks completed or employee utilization rates can uncover top performers and bottlenecks that slow the team down.
- Enhance the reliability of performance tracking. Metrics like revenue per employee and labor costs tie individual contributions to business outcomes and help improve team accountability.
- Improve workflows. Analyzing data from metrics that provide insights, like time spent per task or missed deadlines, helps you address weaknesses in your workflow using strategies backed by hard data.
These insights are invaluable for teams of all shapes and sizes — especially remote ones. That’s why many leaders and managers work hard to find effective ways to measure their teams’ productivity.
Detailed examples of productivity metrics
Common productivity metrics like hours worked aren’t enough without context. Here are a couple of examples:
- A customer service agent who clocks eight hours but has poor customer satisfaction scores isn’t driving results.
- A sales professional might work long hours, but those efforts don’t translate into value without measurable sales growth.
The key is focusing on metrics reflecting performance and aligning with business objectives. Here’s how productivity metrics can be applied across roles and industries:
Time-based metrics
Time-based productivity measures offer a foundational way to track employee performance, but they’re most useful when viewed over an extended period. For example:
- Average task completion time. Average task completion time measures how quickly tasks are completed, but one-off data points can be misleading. A single task that takes a week might seem like decreased productivity, but when averaged across a quarter, it can reveal meaningful trends.
- Example: A software developer logs an entire week on one task while others complete several smaller ones. Zoomed out to a year, the developer delivers complex, high-impact features that ultimately outpace their peers in value and volume.
- Example: A software developer logs an entire week on one task while others complete several smaller ones. Zoomed out to a year, the developer delivers complex, high-impact features that ultimately outpace their peers in value and volume.
- Employee punctuality and attendance. Tracking attendance can highlight reliability, but this metric measures presence, not performance. It’s a good baseline but doesn’t account for the company’s profitability or output, so pair it with more results-driven data.
- Example: A warehouse employee frequently arrives late but works with unmatched efficiency during peak hours, excelling in inventory management and clearing backlogs faster than anyone on the team.
- Example: A warehouse employee frequently arrives late but works with unmatched efficiency during peak hours, excelling in inventory management and clearing backlogs faster than anyone on the team.
- Time spent per project or client. This measures the total hours dedicated to a specific project or client. It helps you calculate productivity by showing whether resources are being allocated efficiently or if certain projects are consuming disproportionate amounts of time.
- Example: An account manager spends double the hours on one high-profile client. While this seems inefficient, the client generates 40% of the company’s annual revenue.
- Example: An account manager spends double the hours on one high-profile client. While this seems inefficient, the client generates 40% of the company’s annual revenue.
- Overtime hours worked. This metric provides insight into workload balance and burnout risks. While some overtime is expected, excessive hours often signal poor planning, understaffing, or a toxic workplace culture. Prolonged overtime can lead to an increased risk of stroke and other health complications.

- Example: A customer support team logs excessive overtime for a month after a product launch. Client reviews and ratings are impressive, but internal surveys show that the support team members have become fatigued and unhappy with their work.
These time-based metrics help identify patterns and make adjustments that lead to smarter resource management.
However, as standalone data, they may give an incomplete picture of business performance. You’ll want to combine them with output-based data whenever possible.
Output-based metrics
Output-based metrics focus on results and are essential for understanding your team’s ability to complete tasks and drive progress toward larger business goals. Here are some key metrics to track:
- Number of units produced. This measures how much tangible output your team creates in a specific timeframe. It’s a straightforward way to evaluate operational efficiency but should be paired with quality metrics to avoid sacrificing standards for speed.
- Example: A factory team increases output by 20% after implementing an automated assembly line.
- Example: A factory team increases output by 20% after implementing an automated assembly line.
- Sales figures per employee. Also considered one of the most important sales productivity metrics, this evaluates a sales representative’s contribution to overall sales revenue. It helps pinpoint top performers while identifying areas where others might need coaching or additional resources.
- Example: A sales rep consistently generates 25% more revenue than their peers by focusing on high-value customers.
- Example: A sales rep consistently generates 25% more revenue than their peers by focusing on high-value customers.
- Customer inquiries resolved. This tracks how well your team handles support or service requests and can lead directly to improved customer satisfaction. Resolving issues faster and more effectively creates loyal customers and reduces churn. Support teams often take this metric a step further by looking at the popular time-based metric average resolution time.
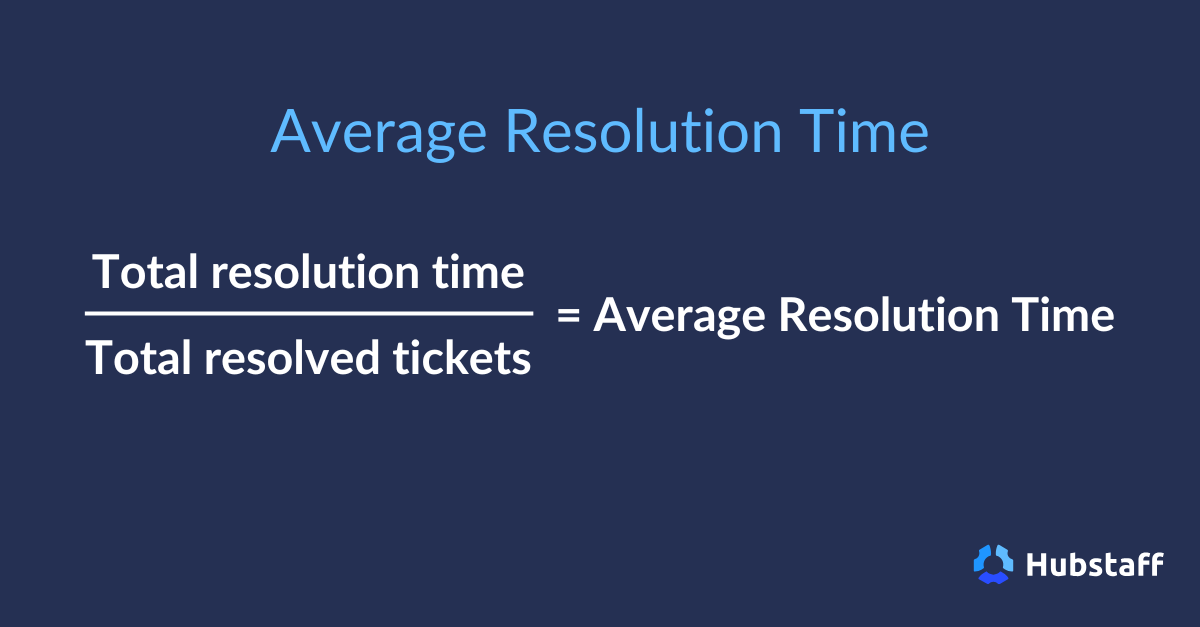
- Example: A support team resolves 90% of customer inquiries on the first attempt after implementing better FAQ resources and training.
- Projects completed per team. This metric provides insight into a project manager’s ability to plan and orchestrate complex projects across different teams. Tracking this over time helps identify patterns and understand the company’s resource usage.
- Examples: A project manager reduces the time spent on monthly routine tasks by 10 hours by improving workflow automation in the team’s project management software. They also implemented direct communication between key team members to eliminate unnecessary approvals.
When paired with time-based data, output-based metrics provide a solid foundation for measuring productivity.
Over the span of a few months, these metrics offer a basic but reliable snapshot of your team’s efficiency and output. For most companies, these two will be enough.
However, if you want to go beyond surface-level insights, you need metrics that let you assess productivity and understand how each team member contributes to broader company objectives. You can then identify strengths, address bottlenecks, and understand how to improve their productivity even further.
Quality metrics
What good is it to churn out a high volume of outputs if the quality is diminished? Quality metrics determine the why behind performance and ensure that the output meets your organizational goals. They don’t just tell you how much work is getting done — they reveal the value and impact of that work.
- Error rates. The frequency of mistakes in deliverables. High error rates signal inefficiencies or training gaps. In contrast, low error rates indicate streamlined workflows and skillful teams.
- Example: A manufacturing team has skilled people, but their error rates are too high. They discover that the lack of a quality control checklist causes this. They implement one and reduce their error rates by 15%.
- Example: A manufacturing team has skilled people, but their error rates are too high. They discover that the lack of a quality control checklist causes this. They implement one and reduce their error rates by 15%.
- Customer feedback and complaints. Positive feedback shows alignment with customer needs, while complaints emphasize areas for improvement. This metric helps gauge whether your work resonates with your audience.
- Example: A customer support team receives frequent complaints about slow resolution times. After analyzing the data, they realized many issues could be resolved with resources like FAQs and guides. They implement a chatbot trained to address common problems and direct customers to the right resources. This allows the team to focus on more complex issues and reduce common complaints by 20%.
- Example: A customer support team receives frequent complaints about slow resolution times. After analyzing the data, they realized many issues could be resolved with resources like FAQs and guides. They implement a chatbot trained to address common problems and direct customers to the right resources. This allows the team to focus on more complex issues and reduce common complaints by 20%.
- Employee satisfaction. Satisfied employees are productive employees. This metric often comes from surveys and helps uncover employee satisfaction issues before they escalate.
- Example: A company notices declining satisfaction scores in survey feedback despite meeting company targets. After identifying that employees feel burned out due to rigid schedules, they pilot flexible work hours for a few months. Satisfaction scores improve by 50%, and employees report feeling more energized and engaged.
- Example: A company notices declining satisfaction scores in survey feedback despite meeting company targets. After identifying that employees feel burned out due to rigid schedules, they pilot flexible work hours for a few months. Satisfaction scores improve by 50%, and employees report feeling more energized and engaged.
- Employee turnover rate. High turnover can indicate deeper problems like low employee engagement or misaligned goals. This metric connects employee well-being to overall productivity.
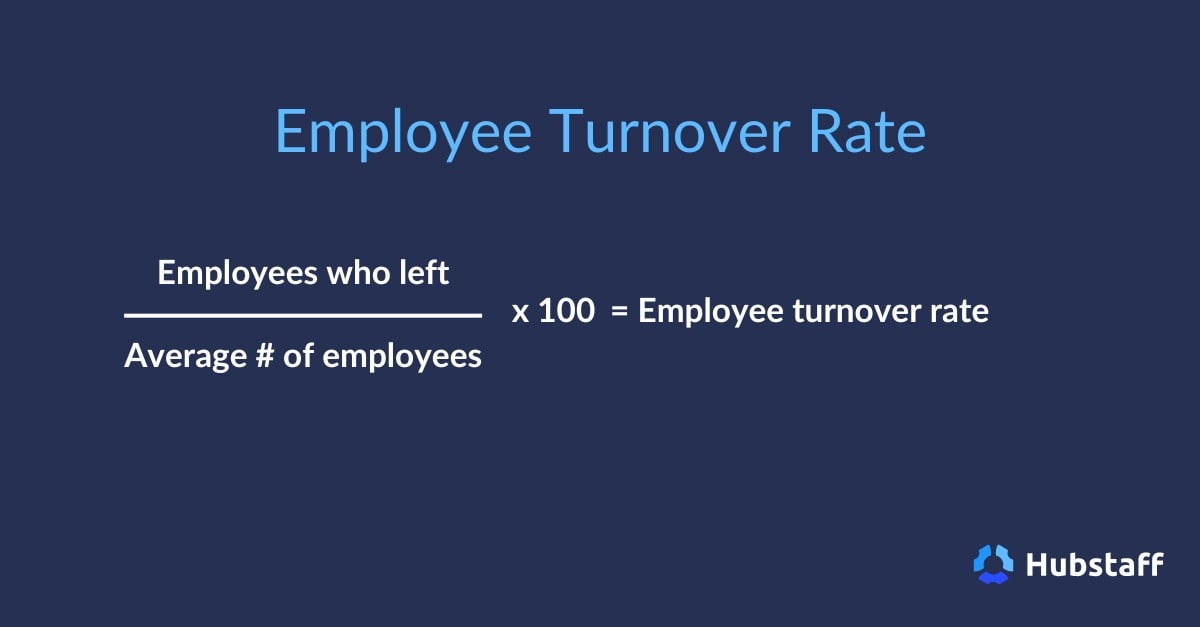
- Example: A company discovers through exit interviews that employees feel unsupported in career growth. From there, they introduce a mentorship program to pair junior staff with experienced leaders to provide them with a clear development path. Over the next year, turnover drops by 25%, and employee engagement surveys show a steady, noticeable boost in morale.
- Marketing effectiveness. Marketing effectiveness measures a marketing team’s ability to create meaningful results like content quality, high-intent traffic, or conversion rates.
- Example: The marketing team intentionally slows down campaign launches to prioritize in-depth audience research and A/B testing. While campaigns take twice as long to launch, they consistently deliver 30% higher conversion rates and attract high-intent traffic that aligns with long-term goals.
- Example: The marketing team intentionally slows down campaign launches to prioritize in-depth audience research and A/B testing. While campaigns take twice as long to launch, they consistently deliver 30% higher conversion rates and attract high-intent traffic that aligns with long-term goals.
- Customer retention rate. Retaining customers is often cheaper than acquiring new ones. This metric evaluates how well your team delivers value over time with recurring customers.
- Example: A subscription-based business notices a high churn rate in the first three months of their annual plans. To combat this, they introduce a personalized onboarding sequence with step-by-step guidance and follow-up check-ins to address customer concerns early. Churn rates decrease by 20% over the next six months.
Because quality metrics vary by team, role, and context, they are harder to track than others. But they’re also the most honest as they reveal the true impact of your team’s work and how it aligns with your organizational goals.
Efficiency metrics
Efficiency metrics measure how effectively resources are being used to drive company productivity and contribute to business success.
- Resource utilization rates. This metric tracks how well your team utilizes time and other resources. High utilization rates often indicate efficiency, but extreme levels can lead to burnout or mismanagement.
- Example: A design team operating at 95% capacity consistently delivers high-quality work. However, by dropping to 80% utilization, they gain breathing room to take on unplanned tasks without risking delays or quality dips. As a result, their motivation shoots up, burnout and absenteeism decrease, and their collaboration improves further.
- Example: A design team operating at 95% capacity consistently delivers high-quality work. However, by dropping to 80% utilization, they gain breathing room to take on unplanned tasks without risking delays or quality dips. As a result, their motivation shoots up, burnout and absenteeism decrease, and their collaboration improves further.
- Cost per unit produced. The total cost of producing a single unit, including materials, labor, and overhead. Tracking this over time helps identify wasteful practices and opportunities to optimize resource allocation.
- Example: A manufacturing team finds that high raw material costs are inflating production expenses. By negotiating bulk discounts with suppliers and automating a key assembly process, they reduce cost per unit by 15% to improve margins without compromising quality.
- Example: A manufacturing team finds that high raw material costs are inflating production expenses. By negotiating bulk discounts with suppliers and automating a key assembly process, they reduce cost per unit by 15% to improve margins without compromising quality.
- Workforce analytics. Activity rates like keyboard time, active hours, or website and app usage can be used to measure employee productivity, but they only work when paired with broader insights. Productivity levels are designed to support, not micromanage.
- Example: A writing team clocks fewer hours in a day after transitioning from office to remote. However, workforce analytics now show they spend 90% of their time on focused websites and tools, indicating higher engagement. As a result, their output remains consistent in quality, and their average productivity rate rises over time.
- Resource allocation efficiency. Measures how well resources are assigned to tasks or projects. Balanced allocation can significantly boost team performance.
- Example: A project manager reviews workforce analytics data to discover some team members are repeatedly overburdened while others have capacity. They redistribute workloads and reassign priorities, leading to improved delivery times and a 25% reduction in burnout complaints.
Efficiency metrics are extremely powerful. Be careful, though.
Without context, these numbers can easily become vanity metrics. When used responsibly, they offer some of the most actionable insights for making process improvements and increasing team performance.
Tools for measuring productivity
Using the right tools can make all the difference in accurately tracking and improving productivity and overall company performance.
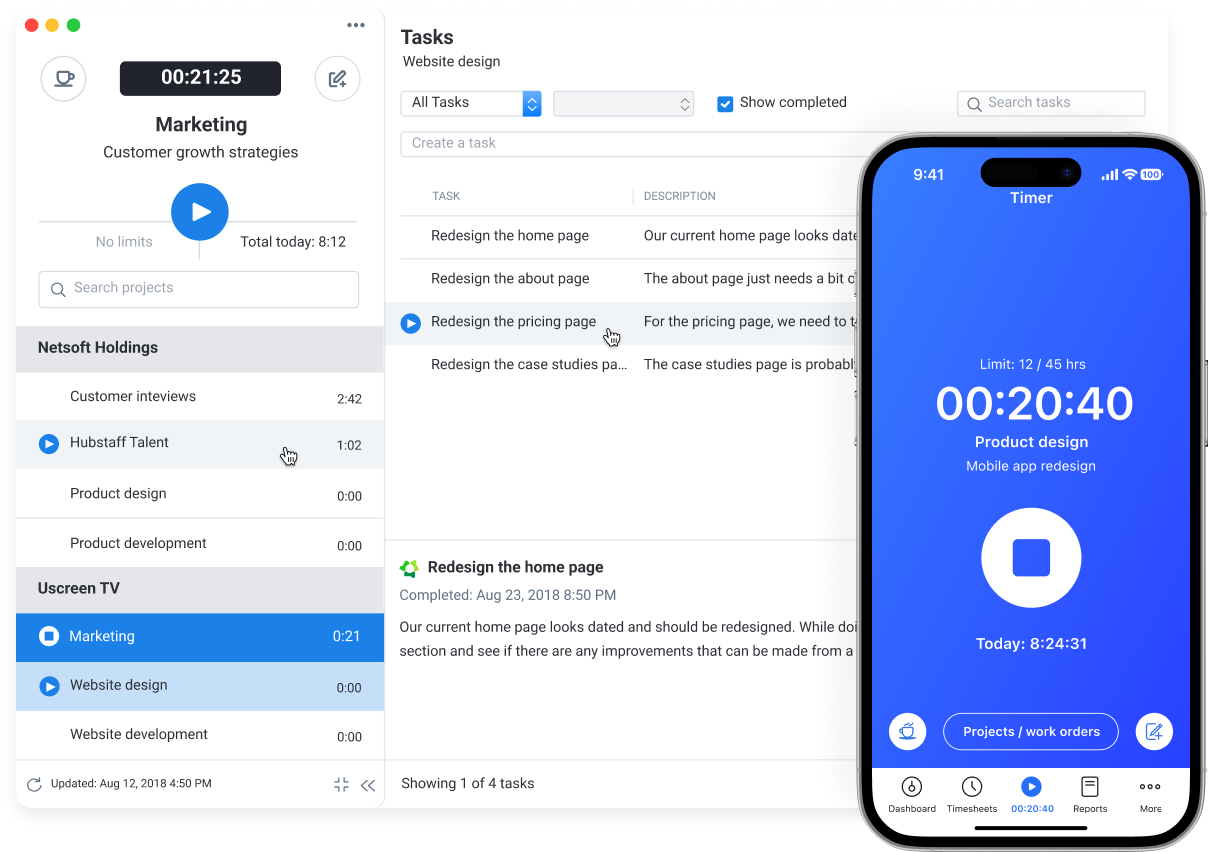
- Time tracking tools. Time trackers help monitor how team members spend their hours to provide insights into workloads and find opportunities to optimize schedules. Many of these tools also have built-in invoicing and payroll capabilities to further streamline processes.
- Recommended tools: Hubstaff, Clockify, and Toggl Track
- Project management tools. Enable teams to collaborate, assign tasks, and build workflows. Several project management tools allow you to plan time budgets for different projects, set dependencies, and even plan team capacities with intuitive features.
- Recommended tools: Trello, Hubstaff Tasks, and Asana
- Recommended tools: Trello, Hubstaff Tasks, and Asana
- Workforce analytics platforms. These platforms go beyond time tracking to provide data on employee activity, engagement, and trends in granular detail. They also reveal specific metrics like utilization rates, time spent in meetings, and more.
- Recommended tools: Hubstaff, ActivTrak, and Insightful
- Recommended tools: Hubstaff, ActivTrak, and Insightful
- Employee engagement platforms. These tools gauge team satisfaction and engagement. With features like pulse surveys and feedback collection, they highlight pain points and reveal trends that impact morale.
- Recommended tools: Lattice, Workleap Officevibe, and 15Five.
Best practices for implementing productivity metrics
- Tie metrics to your business goals. Every metric should connect to your key objectives, like improving labor productivity or boosting customer retention. Metrics that don’t align with these goals aren’t worth tracking.
- Incorporate feedback into metrics design. Employees and managers who use these metrics every day can offer valuable input. Their feedback ensures you’re developing SMART goals — Specific, Measurable, Attainable, Relevant, and Time-Bound.
- Balance quantity with quality. High company output doesn’t mean much if quality is compromised. To paint a complete picture, use metrics that track both efficiency and outcomes. An example might be tracking error rates alongside production levels.
- Regularly review and refine your metrics. Priorities naturally shift over time, so operations should change to accommodate those, too. As a result, outdated metrics can quickly lose relevance.
- Set realistic benchmarks for success. Productivity metrics should challenge your team without setting them up for failure. Use historical data or industry standards to establish baselines that are ambitious but achievable. Don’t know where to start? You can access industry-specific benchmarks with Hubstaff Insights.
Conclusion
Productivity metrics show you where your team stands and what’s holding them back.
Used right, they help you measure progress, identify trends, and pinpoint how to generate revenue with fewer resources.
If used wrong, you’ll become just another company chasing numbers that don’t matter.
The real value comes when you adapt metrics to fit shifting goals and use them to build a sharper, more engaged team. Track what matters, cut what doesn’t, and turn your data into results that move the needle.
Most popular
How to Spot and Manage Work Overload Before Your Best People Burn Out
Work overload occurs when the demands placed on an employee or team exceed their available resources, leading to stress, burnout,...
Workplace Productivity Statistics in 2026: What the Numbers Say
For many businesses, having the ability to maximize output without compromising quality gives them a major edge over their competi...
Time Doctor vs. ActivTrak: Which Tool Is Right for Your Team?
Time Doctor and ActivTrak are two of the most powerful and popular time tracking solutions. Both have strong features, and both ca...
Work-Life Balance Statistics in 2026: A Global Perspective
Work-life balance has become a deciding factor in how people, especially Gen Z, choose or leave jobs. The data shows that work-lif...