How to Measure Employee Engagement: Metrics & KPIs
- Engaged employees are 87% less likely to leave, yet only 36% are currently engaged — closing this gap with tools like Hubstaff can directly boost retention and productivity.
- Tracking both turnover and retention rates reveals the full picture: with voluntary turnover projected at ~24%, proactive engagement strategies are essential to stay ahead.
- Satisfaction and engagement are distinct metrics, but together they drive 17% higher productivity — measuring both is critical to building a high-performing, committed workforce.

Measuring employee engagement is no longer optional in a post-pandemic landscape. Engaged employees have higher employee productivity rates, lower absenteeism rates, produce better business outcomes overall, and have fewer workplace safety accidents.
To remain competitive, business leaders must do everything they can to improve employee engagement. Companies should:
- Set reasonable performance benchmarks
- Give human resources the tools they need to do their best work
- Allocate the correct number of employees to each project.
This article will explain how to measure employee engagement and use those measurements to drive higher profits.
Boost your team’s efficiency with Hubstaff's productivity tools
What is employee engagement?
Employee engagement gauges an employee’s dedication to their work and the organization as a whole. There tends to be a direct correlation between employee engagement, performance, and retention.
Engaged employees are 87% less likely to leave their company. Unfortunately, only 36% of employees are engaged at work. This doesn’t necessarily mean that most employees are unhappy. While satisfaction (happiness) levels impact engagement and vice versa, the two employee measurements are different.

Satisfaction vs. employee engagement comparison
Satisfaction measurements reflect the disparity between what an employee expects and their reality in the workplace. As previously mentioned, employee engagement measures one’s dedication to their work. To put this in perspective, let’s take a look at an example:
Carla is a production worker earning $21/hour. She comes to work each day on time. She’s been with the company for several years and has helped boost production by designing ergonomic office spaces.
At a glance, she seems happy in her job — but here’s how a satisfaction level differs from an engagement level:
- She believes she is worth $29/hour
- She wants to work from home to cut commuting and childcare costs
- She has considered looking for other jobs
From a company perspective, Carla is fully engaged. She’s quick to help colleagues with special projects, willing to come in on short notice, and has a high production volume. She also has minimal QA rejections or edits required.
The only negative comments in her employee jacket indicate she occasionally forgets to take mandated breaks, perhaps because she’s focused on meeting quotas.
Carla’s story is a perfect example of how satisfaction measurements reflect the disparity between what an employee expects and their reality in the workplace. It’s easy to see that higher employee engagement rates do not necessarily make for higher satisfaction scores (or vice versa).
However, satisfaction can still help measure employee engagement.
How to measure employee engagement
In Carla’s case, one would hope that employee engagement surveys would show that she is ready to take on a supervisory role. The promotion (and some hybrid work arrangements) could elevate satisfaction levels and encourage her to stay.
Of course, there are several ways you can measure employee engagement:
- Use activity monitoring. Use a productivity tracker to measure keyboard and mouse activity, website and app usage, and more.
- Check employee retention. Track company-wide retention rates to better measure engagement.
- Check your absenteeism rate. Excessive absences could symbolize a bigger problem.
Engaged employees with high satisfaction levels delivered higher quality outputs and increased employee productivity by 17%.
Of course, an employer cannot address low engagement rates without first measuring them. So, how does a company effectively measure disengagement and position itself for higher profits?
This four-point action plan will get you there.
Identify strengths and areas for improvement
Measuring employee engagement starts with identifying strengths and weaknesses. An engaged workforce tends to have lower absenteeism rates and higher retention rates.
Another metric to explore is sales volume. Client disengagement may be the reason sales are stagnant or declining. This can then affect employee morale.
Observe engagement trends
Engagement trends evolve over time. An observant HR team will notice as employees’ needs change. Today’s employee engagement trends have shifted toward remote working arrangements. Remote teams have no commute and more time for family. One could also argue that there are fewer distractions and office politics.
Build employee trust
The process of building remote employee trust can range from making a few strategic tweaks to completely overhauling your company culture. It’s also important to consider how scheduling impacts the employee experience.
Employee recognition programs that reward desirable performance require low effort and expense on the employer’s part. While driving profitability and pushing new initiatives are important, providing a healthy work-life balance gives workers the motivation they need to do their best.
Uphold strong communication
Transparency and superior communication drive trust. When employees know what is expected of them and have the tools to achieve their goals, they’ll generally be more engaged.
Good communication across all channels — email, video meetings, employee reviews, etc. — shows workers they are valued. Companies that welcome positive and negative input are more likely to succeed here.
Effective engagement measuring strategies
Measuring employee engagement may look different for different organizations. Each company has unique operational strategies based on its respective business models and industries. These strategies focus more on qualitative data collected via direct employee feedback about individual and team experiences.
Let’s take a look at a few strategies.
One-on-one meetings
One-on-one meetings provide opportunities to give and receive feedback. A more conversational employee evaluation approach allows workers to explain challenges and victories.
As they discuss their employee experience, the supervisor can provide coaching and support. These conversations may involve productivity, mental health, or the employee’s chances for promotion.
One-on-one meetings are excellent avenues to develop core company values and introduce new initiatives. When meeting attendees, use open-ended questions to drive the conversation. Both parties will gain deeper insights into other team members’ feelings and thoughts about a particular topic.
Pulse surveys
Pulse surveys are typically shorter and easier to complete than annual engagement surveys. They involve frequent check-ins when work-related experiences are fresh in the employee’s mind.
These surveys aim to “check the pulse” of respondents frequently to ease the burden of annual reviews. For example, a sudden surge in customer demand may mean employees need to work more overtime. This survey type could help companies decide whether or not to bring on temporary employees.
Focus groups
Focus groups are moderated meetings designed to provide companies with deeper insights into the qualitative aspects of worker experiences.
These groups are usually kept small, with a dozen or fewer employees. The moderator delivers an agenda before the meeting and asks attendees to provide opinions or feelings about a topic.
Presenting new initiatives to a smaller group is a great way to gauge feelings, needs, expectations, and job satisfaction in a smaller group. This way, you can glimpse how the entire company will feel about significant changes before you actually make them.
“Workforce engagement research estimates the cost of lost productivity generated by disengaged employees in the US to be as high as $550 billion annually.“
Gallup
Exit interviews
As part of the overall employee engagement strategy, HR teams conduct exit interviews to identify aspects of the company culture that need improvement.
Exit interviews can be emotionally charged, but they’re essential for identifying enhancements and detractors that affect employee productivity. Exit interviews and employee feedback are valuable for identifying resignation rates, advancement opportunities, and cultural issues that might have gone overlooked.
While companies can’t stop every employee from moving on, they can identify what drove them to that decision. From there, they can improve initiatives and increase retention efforts accordingly.
Engagement metrics and KPIs to review
While capturing qualitative data related to job satisfaction and employee engagement is more critical than ever, it’s not the be-all and end-all. Quantifying performance using metrics and KPIs is equally valuable as a workforce management strategy.
When organizations monitor their retention rate, absenteeism rate, and turnover rate, it provides actionable insights that can drive change. Of course, there are plenty of other KPIs to explore. Let’s take a look.
Employee Net Promoter Score (eNPS)
The eNPS (or NPS) promoter score is a measurement tool that measures employee satisfaction rates. Think of it as the workforce management equivalent to how retailers measure qualitative data about consumer loyalty.
Scoring is often tied to other qualitative employee surveys. Employees answer questions to determine how they feel about their employee experience.
Ratings from zero to ten give employers a numeric value representing their emotional response to the company’s current state. Questions might range from company benefits packages to how much they trust the organization they work for.
The scores identify promoters (those with favorable scores of 9-10), passive participants (those with scores of 7-8), and detractors (those with negative scores of 0-6). Managers can include all groups, ignore passive participants, or artificially manipulate upper and lower score ranges if you want to use a 0-5 standard.
Here’s an example:
A company has 100 employees. Eighty employees (80%) are promoters. Five (5%) employees score the company between 0 and 6. These are detractors. The remaining 15 (15%) employees are passive, somewhat satisfied, but not highly enthusiastic about the organization or their jobs.
If you consider the passive votes a net zero, the eNPS is +75.
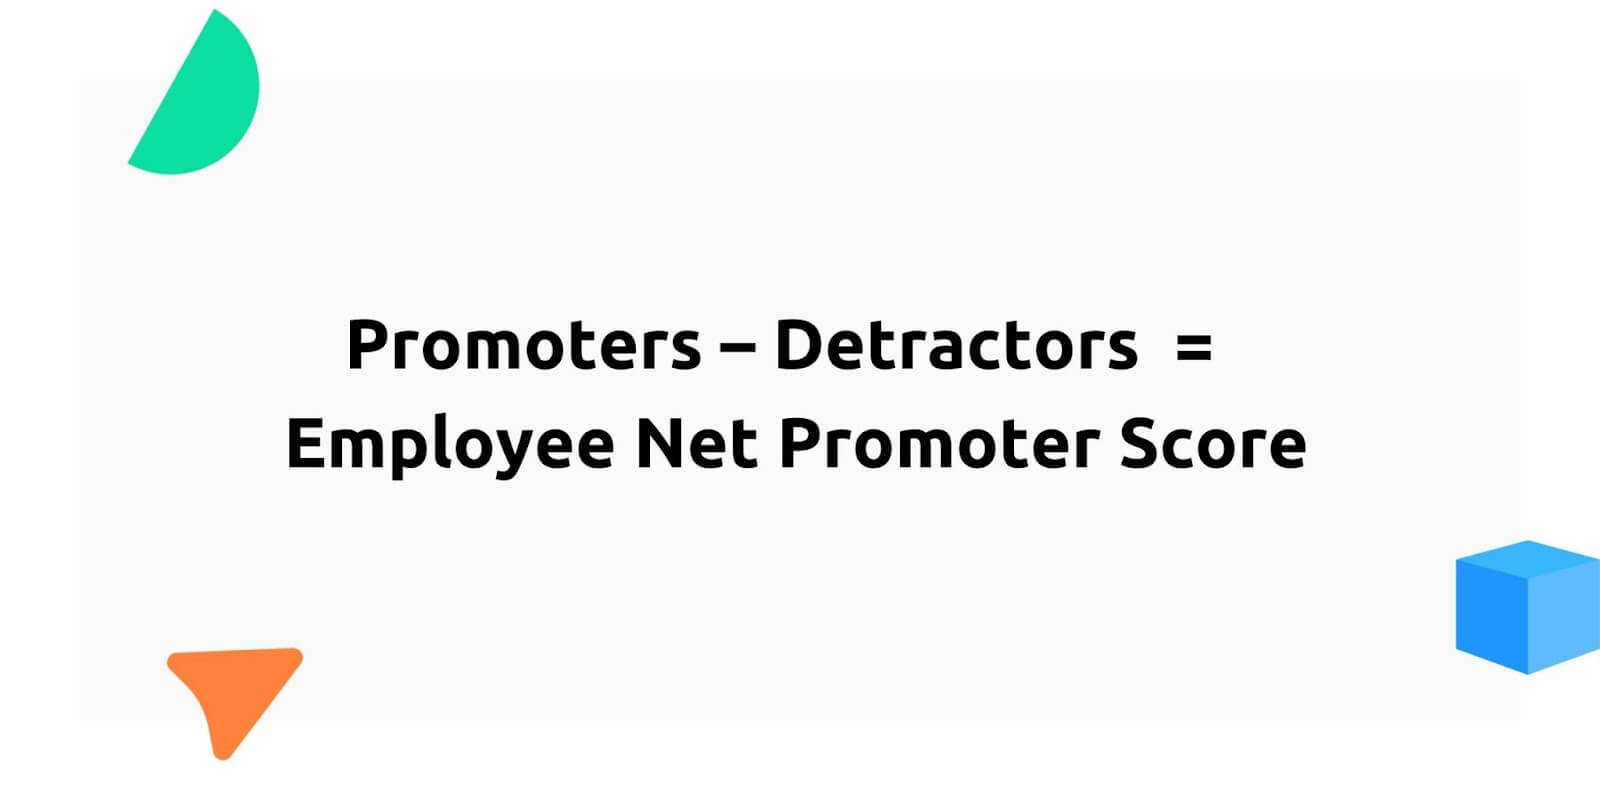
Promoters (80%) – Detractors (5%) = 75% Employee Net Promoter Score
Employee absenteeism
All forms of absenteeism can directly impact employee performance. That said, it’s critical to differentiate between approved and unapproved absences when analyzing employee productivity KPIs.
While the ideal employee absenteeism rate is zero, setting realistic goals is essential. When focusing on absence management, managers often separate these approved and unapproved metrics in order to schedule and allocate resources appropriately.
Even the most loyal worker may get sick from time to time. The National Center for Health Statistics (NCHS) estimates the common cold in the US causes approximately 45 million days of restricted activity.
You can calculate absenteeism rates using this formula:
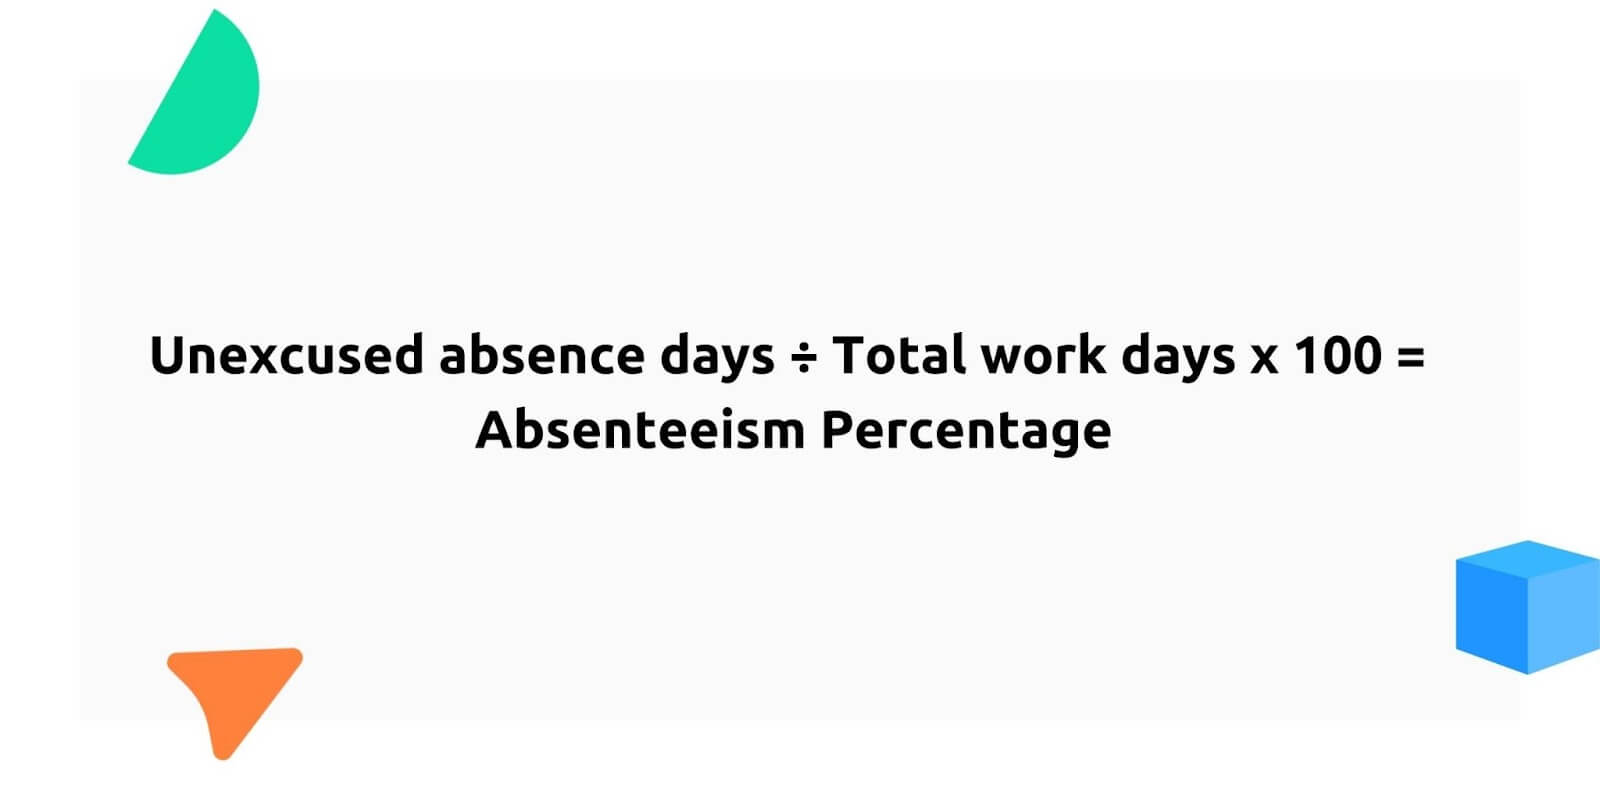
Unexcused absence days ÷ Total work days x 100 = Absenteeism Percentage
Assuming your company had 16 unexcused absences in a predefined period of 200 work days, the formula would look like this:
16 ÷ 200 x 100 = 8%
You could use the same formula to calculate total absenteeism rates (both approved and unapproved days off). Depending on your workforce management goals, you can also focus on just the excused absenteeism rate.
Here is an alternative absenteeism rate formula:
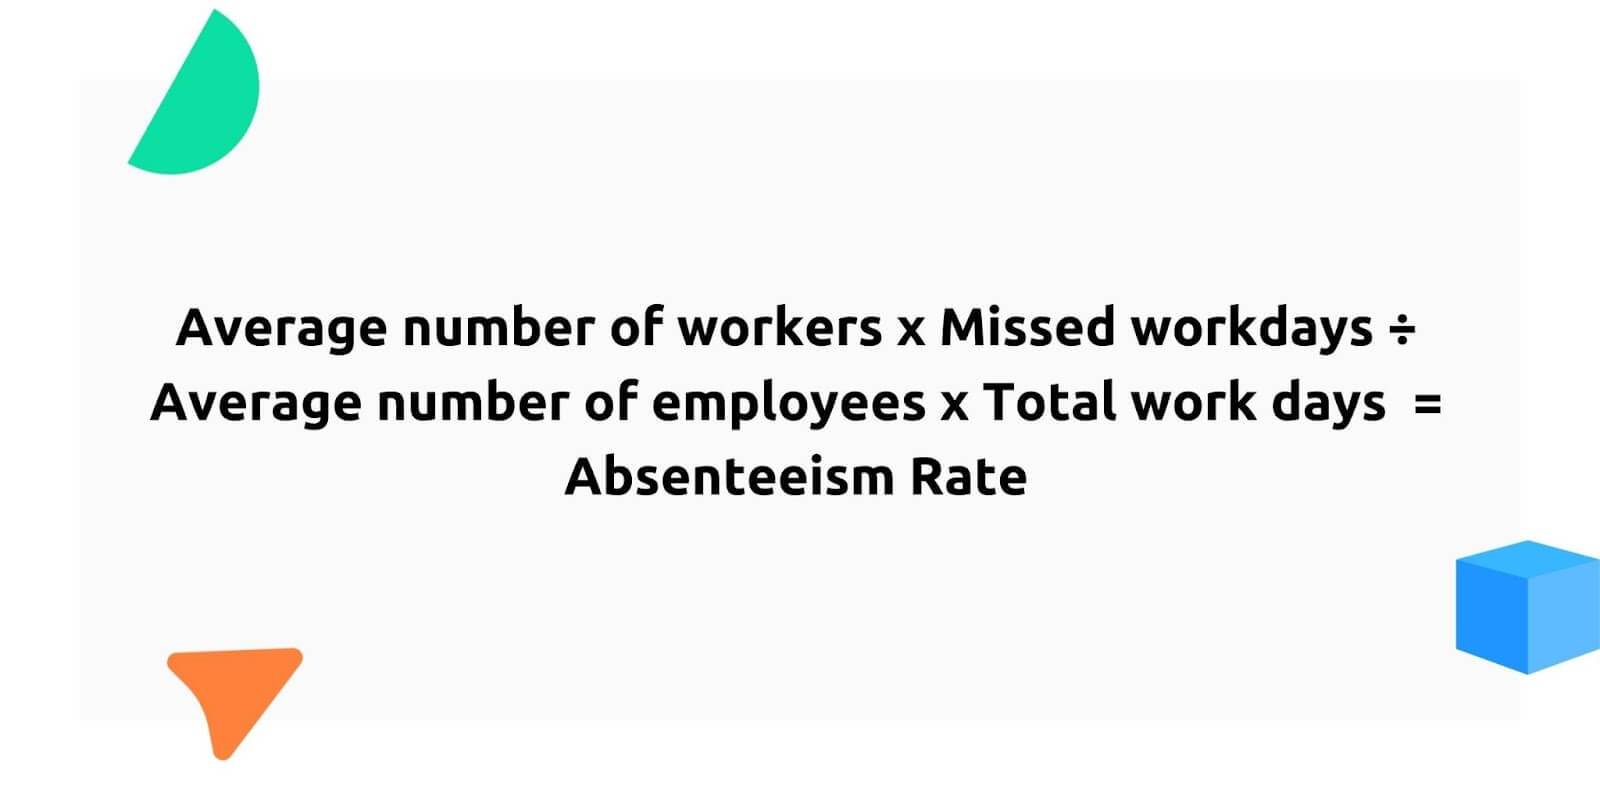
Average number of workers x Missed workdays ÷ Average number of employees x Total work days = Absenteeism Rate
Employee turnover rate
Monitoring employee turnover rates periodically provides a snapshot of workforce stability. For example, 92% of employees believe empathy in the workplace is essential for improving retention rates.
Here’s the formula:
Total number of employee exits per year ÷ Average number of workers in a year x 100 = Turnover rate
Employee retention rate
Calculating retention rates is simple. Just divide the number of employees still working on the team by the initial number of employees during the same period. Then, multiply that number by 100.
You can calculate employee retention rates over days, weeks, months, or years. Run these numbers in Excel or your employee tracking software.
For example, let’s say you want to monitor quarterly employee retention rates.
Let’s say you had 78 team members on the payroll on June 30th. First, you would identify how many employees were on the payroll at the beginning of the quarter. Let’s say that you had 100 workers on April 1st. Your formula for calculating retention rates would look like this:
The number of veteran workers on June 30th (78) divided by the number of workers on April 1st (100) x 100 = Company retention rate per quarter (78)
In numeric form only: 78 ÷ 100 X 100 = 78%
Gartner’s research suggests employers can expect the voluntary turnover rate to be approximately four percent higher (24%) in 2022 than in the pre-pandemic period.
Lower than expected retention rates may signal your workforce is not fully engaged. You won’t be able to tell if work-life balance, low wages, or lack of growth opportunities are the culprits.
However, this formula will let you know if you need to address job satisfaction levels that can keep your workforce intact.
Utilize a tool for measuring engagement
Every company should have a comprehensive set of valuable tools for gauging employee engagement, enabling data capture and analysis.
Here are a few we recommend:
- Hubstaff: Hubstaff’s employee productivity measurement features capture mouse and keyboard usage data. The app is an excellent addition to every company’s tech stack.
- SurveyMonkey: A versatile survey tool that can be used to create custom employee engagement surveys.
- Qualtrics: Offers advanced analytics and customizable survey templates specifically for measuring employee engagement.
- 15Five: Combines continuous feedback, pulse surveys, and performance reviews to measure and improve employee engagement.
- Lattice: Integrates performance management with employee engagement surveys to comprehensively view workforce sentiment.
If you’re looking for ways to improve talent retention rates, enhance organizational performance, and drive higher profitability, sign up for a 14-day free trial today!
Subscribe to the Hubstaff blog for more posts like this
Most popular
How to Spot and Manage Work Overload Before Your Best People Burn Out
Work overload occurs when the demands placed on an employee or team exceed their available resources, leading to stress, burnout,...
Workplace Productivity Statistics in 2026: What the Numbers Say
For many businesses, having the ability to maximize output without compromising quality gives them a major edge over their competi...
Time Doctor vs. ActivTrak: Which Tool Is Right for Your Team?
Time Doctor and ActivTrak are two of the most powerful and popular time tracking solutions. Both have strong features, and both ca...
Work-Life Balance Statistics in 2026: A Global Perspective
Work-life balance has become a deciding factor in how people, especially Gen Z, choose or leave jobs. The data shows that work-lif...