productivity benchmarks report
guide

2025 Productivity Benchmarks: Focus Time, Industry Stats & Team Insights

When building a high-performing team, productivity benchmarks can help reveal your biggest strengths and where your workflow needs improvement.

By comparing inputs to outputs, benchmarking productivity helps identify how effectively individuals meet goals and expectations. But without up-to-date industry productivity reports, it's difficult to know how your team's performance compares with industry standards.As a leading time tracking platform, we've analyzed anonymized data from over 185,000 Hubstaff users across 22,000+ organizations to deliver the most accurate and up-to-date employee productivity statistics available.

Most of these statistics are taken from the Hubstaff 2025 Workstyle Report, which outlines evidence-based data on productivity stats across different workstyles, industries, teams, and more.

Use this 2025 productivity benchmark data to:

  • Compare your team's productivity to industry standards

  • Identify performance gaps in remote, hybrid, or in-office settings

  • Build more effective schedules, deep work policies, and process improvements

Where teams are most productive 

The modern workplace is evolving — whether remote, hybrid, or in-person. What truly drives productivity is an environment that supports psychological well-being, autonomy, and open communication.

A data-driven approach can help leaders make informed decisions to optimize team performance across work settings and increase focused, deep work. We’ve used the Hubstaff Insights add-on to explore productivity data for in-office, remote, and hybrid teams.

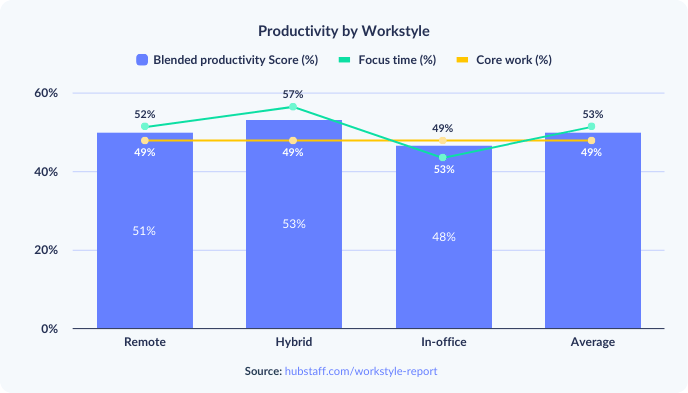
The Hubstaff Insights add-on defines focus time as 30 minutes or more of uninterrupted work sessions with minimal distractions, but the metric varies across roles. 

For instance, writers may experience longer focus time than customer support agents who handle frequent calls.

Key takeaway: The data shows how close the average focus time is for both remote and hybrid teams, which makes it clear that being in the office doesn't signal higher productivity.

Understanding blended productivity score

Blended productivity combines two key metrics: focus time and time spent on core tasks.

Formula: (Productivity Score) = (Focus Time % + Core Work %) / 2

WorkstyleBlended Score (%)

Hybrid

53.0

Remote

50.5

In-office

47.5

All Teams

51.0

Calculate productivity rates to uncover how efficiently your team works.

If your team's score is below 47.5%, it may be time to reevaluate how time is allocated or remove barriers to productivity, such as meetings or distractions. 

Use the blended productivity score to:

  • Pinpoint productivity patterns that are causing delays.

  • Provide employees with personalized feedback.

  • Make informed decisions when implementing performance and process improvements.

Key takeaway: Use blended productivity data as a diagnostic tool to spot inefficiencies and course-correct workflows.

Worktime classifications across teams 

Across more than 133,000 users, Hubstaff breaks down work time into three main categories:

  • Core tasks (key deliverables): 49%

  • Non-core tasks (emails, admin, support): 43%

  • Unproductive time (unproductive apps, distractions, context switching): 8%

This breakdown shows that nearly half of the time is spent outside direct deliverable work. This is an eye-opener for leaders who want to understand what is slowing teams down, such as ad hoc requests or meetings.


Use this data to protect focus time by introducing:

  • No-meeting days to support core work

  • 90-minute deep work blocks

  • Better calendar hygiene for leaders

Key takeaway: A clearer understanding of task types can help leaders structure time more intentionally for high-impact output.

Activity by day of the week or hour of the day

Hubstaff's activity rate feature quantifies the percentage of mouse and keyboard inputs during tracked time. You can use the data for real-time productivity updates to spot employees’ peak hours, most productive days, and what apps and URLs they use to reach these levels.

For a more in-depth look, you can use the Time & Activity report for a better glimpse into the time and money spent:


Hubstaff then helps you compare these rates across teams, roles, and even other Hubstaff users in your industry. These insights create a framework for organizations to understand when they're productive, benchmark team performance, and implement data-driven improvements to deep work strategies and task allocation.

Hours of the day vs. tasks completed

While Hubstaff’s Workstyle Report doesn't currently provide an hour-by-hour breakdown of productivity and tasks completed, you can see real-time data on hours and tasks worked for each user from the dashboard to draw your own conclusions.

However, existing Hubstaff data shows a strong connection between deep work periods (calculated using Hubstaff's focus time metric) and task completion rates.

Teams prioritizing uninterrupted blocks consistently complete more core tasks (or high-impact work tied to business goals) in that time frame. 

This focus-driven approach not only increases productivity but also improves the quality and strategic value of output. As organizations strive to optimize performance, encouraging and protecting focus time remains one of the most effective ways to enhance team efficiency and bottom-line impact.

Productivity benchmarks by industry

Productivity benchmarks by industry differ due to workflow structure and task types. For instance, software productivity benchmarks will vary significantly from health care or education.

Benchmarking productivity across roles and industries helps you:

  • Set realistic expectations

  • Spot inefficiencies unique to your field

  • Improve work allocation

The Hubstaff Workstyle Report shows average productivity stats across industries:

IndustryAverage Productivity (%)

Design

61

Freelancing

55

Professional Services

54

Software

49

Healthcare

50

Education & Public Relations

~40–41

Use this data to identify and improve team performance:

  • Benchmark your team's output against industry averages

  • Run a competitive analysis to understand your positioning against competitors

  • Optimize task allocation and monitor the impact on productivity


As shown in the figure, education, marketing, and public relations teams typically show lower focus time, often due to context-switching and meeting-heavy schedules. 

Understanding these small nuances can greatly assist performance evaluation, add context to work patterns, and help with better resource allocation to boost productivity. 

Key takeaway: Use industry-specific benchmarks to set performance goals, allocate resources more effectively, and implement role-appropriate productivity strategies.

Productivity benchmarking by company size

Team size also affects productivity. Smaller organizations spend more time on focus but less time on core tasks than larger companies.

MetricSMBs (%)Large Orgs (%)

Focus Time

50

46

Core Work

45

48

Non-core work

45

42

Unproductive

10

10

Smaller teams benefit from lean operations, while larger organizations may experience more meetings, handoffs, or approval cycles that reduce focus time.


Use company-size benchmarks alongside industry data to make smarter decisions:

  • Set role-specific goals, streamline workflows, and boost productivity without burnout

  • Streamline non-core work through automation and better delegation

  • Reduce meeting loads and encourage task ownership to preserve focus

  • Regularly monitor and reiterate changes in team structure that impact core productivity metrics

Key takeaway: Industry and company size shape your teams' productivity. By benchmarking across these two areas, you'll understand what "efficiency" means and how to achieve it.

How to use productivity benchmarks to increase efficiency

Leaders use productivity benchmarks to make smarter, data-informed operational decisions. 

Here are a few practical ways to use productivity stats and benchmarks:

  • Align team performance expectations with industry and role-specific productivity stats to ensure goals support broader company objectives.

  • Implement strategies to minimize distractions and promote deep work. Identify areas to improve on using methods like time-blocking, async communication, or meeting-free zones—to help teams stay on track and productive.

  • Use metrics like focus time and core task completion to determine what challenges are keeping your team from doing meaningful, revenue-driven work.

  • Compare your team's productivity metrics against competitors to identify performance gaps to increase productivity, reduce labor costs, and identify training and staffing needs.

  • Monitor high-performing team members for signs of overutilization, unsustainable work habits, or declining focus time to manage workload and protect long-term performance proactively.

Find out how your team compares

Understanding how your team works is the first step toward improving performance. 

Hubstaff gives you access to the same productivity insights used in this benchmark data, from focus time and task categorization to activity rate and attendance trends.

Use these benchmarks as your baseline, and let Hubstaff help you improve your current performance.

Want to try it out?

Think of your Hubstaff dashboard as this report come to life.

Start your Hubstaff free trial