global work report hero image
Report

The 2026 Global Trends and Benchmarks Report: How Work Gets Done

Global teams are now the default. Work happens across time zones, workstyles, and a growing stack of tools.

The big questions for 2026 have moved past remote versus office. Leaders are setting work rhythms that fit distributed teams. They're protecting focus time, trimming bloated tool stacks, and getting AI past the experiment stage.

They’re also starting to read 50+ hour weeks as a sign that the system needs fixing.

The 2026 Global Work Index analyzes anonymized data from more than 140,000 workers and 17,000 organizations using Hubstaff, a time tracking software with productivity monitoring and workforce analytics features, alongside external research. 

The goal is to share trends, benchmarks, and insights that leaders can actually apply.

Hubstaff data shows that focus time is now the rarest resource on global teams. Hours get eaten by meetings, messages, and tool-hopping.

Hybrid teams feel the squeeze most, logging the lowest share of real focus time. Here’s what it means for how you run your team:

  • Work rhythms vary significantly by role, industry, and workstyle.
  • Triple-peak workdays run like two days in one: intense and powerful when they’re deliberate.
  • Focus time is emerging as the new benchmark and KPI for productivity.
  • 2025 was the year of AI experiments, and 2026 has to be the year of action.
  • Tool overload and context switching are eroding attention.
  • 50+ hour weeks signal a capacity-planning problem worth fixing.

For global and distributed teams, 2026 is the year to stop coping and start redesigning how work gets done.

Trend 1: Embracing diverse work rhythms

One size doesn’t fit all when it comes to work patterns, and global teams are figuring this out. Different roles run on different rhythms.

Creators need long, uninterrupted blocks, customer-facing teams need to respond quickly, and managers spend much of their day coordinating.

Rather than forcing everyone into one 9-to-5 mold, leaders are setting flexible “benchmark ranges” for what healthy productivity looks like.

Our data makes the split clear. Individual contributors (ICs) and managers run on completely different rhythms, so expecting their calendars to match is unrealistic:

  • Individual contributors. About 5 meetings a week, roughly 4 hours, around 10% of their working time.
  • Leaders and managers. About 13 meetings a week, roughly 9 hours, around 25% of their working time.

External research backs this up. Asana’s Anatomy of Work Global Index found that unnecessary meetings drain 3.6 hours a week from senior leaders and 2.8 hours from knowledge workers, and executives were 30% more likely than the average worker to miss deadlines because of too many meetings.

Microsoft’s Work Trend Index shows roughly half of all meetings cluster in mid-morning and early afternoon, right when people hit a natural productivity peak.

Hubstaff data shows the average person now sits in a little more than twice as many meetings per year, and the typical organization runs almost six times as many, compared with two years ago.

Our Time Zone Overlap Playbook treats maker-time (09:00 to 11:00) as sacred, with no recurring meetings and the first live meeting no earlier than 11:30. Anything before 09:00 or after 18:00 should stay a rare exception.

Hubstaff data shows the reverse happening in practice. 26% of all meeting minutes land in the 09:00 to 11:00 maker-time window.

The core 13:00 to 17:00 “review and decision” window carries 36% of meeting time, which is closer to the intent. Even so, 30% of all meeting minutes fall outside 09:00 to 18:00 altogether.

So we’re spending roughly a quarter of all meeting time in deep-work hours and nearly a third outside the standard day.

Employees now average about 25 meetings per person each month. Around 70% are recurring, and those tend to run 7 to 10 minutes shorter than one-off meetings.

Tighter recurring routines are good news. The catch is that an inefficient recurring meeting repeats every week, so the wasted time keeps compounding.

For a clearer picture of what good looks like in practice, turn to the 2026 Benchmarks Pack: The Global Team’s Productivity Index. Use the Index to understand the big shifts and decide where to change.

Then use the benchmarks pack to answer a more practical question: for teams like mine, what should we be aiming for?

Your benchmarks and guardrails should reflect those differences in rhythm:

  • Engineers and analysts. Around 40% of time in deep focus, with relatively lean meetings.
  • Team leads and managers. A higher meeting and coordination load. Keep recurring status calls under 25% of the week.
  • Customer-facing roles. Tighter response times and more micro-interactions, with protected blocks for follow-through and project work.

In 2026, the move is toward flexibility within guardrails instead of one-size-fits-all targets.

Leaders are trading “no one should have more than X meetings” for something more useful: “this role or team should sit within this range of meetings and focus time, and we’ll look into it when people fall outside it.”

Use benchmarks as guideposts. They flag when someone’s work pattern drifts into unhealthy territory, and they work best as a guide rather than a fixed rulebook.

When companies design for different rhythms and make expectations explicit, they respect varied workstyles and keep productivity up without adding meetings for everyone.

Trend 2: Focus is the new KPI

Amid notifications, meetings, and tool sprawl, uninterrupted focus time has become the core productivity metric to watch.

Deep work, meaning sustained and distraction-free effort on meaningful tasks, is where most real progress happens.

Across our data, the average person spends roughly 39% of tracked time in deep focus, or 2 to 3 hours of real focus a day. The pattern sharpens when you slice by role and workstyle:

All roles (140 thousand workers, 17 thousand organizations)

  • 39% of tracked time in deep focus
  • 2 to 3 hours of real focus per day
  • Focus percentage in the low 30% range

High-focus roles (engineers, VAs, designers, finance, writers, SEO, data analysts)

  • 40 to 44% of the week in deep focus
  • Around 2 to 3 hours of focus per day

Highly collaborative roles (product and project managers, marketing managers, founders)

  • Just 1 to 2 hours of focus per day
  • Focus drops into the mid-20% range

By workstyle

  • Office-based teams: 45% focus
  • Remote teams: 41% focus
  • Hybrid teams: 31% focus

Collaboration is powerful up to a point. “Work about work” (meetings, status updates, searching) now eats a disproportionate share of time, more than 20% for many teams.

Time spent on work about work, by team:

  • Developers: 82% of time on work about work, around 35 hours a week.
  • Marketing: 64% of time on work about work, around 20 hours a week.
  • Sales: 56% of time on work about work, around 15 hours a week.

time-spent-on-work-by-team.png

The spread of meetings across the day matters as much as the total. In the 9 to 5 window, every hour carries a meaningful share of meeting time.

Each hour accounts for roughly 4 to 10% of all meeting minutes, so there’s no clean “meeting block” and no long quiet stretch.

Layer that over a typical weekday of about four meetings and 185 minutes in meetings, and a familiar pattern shows up:

  • A standup in the morning
  • A quick sync late morning
  • A check-in after lunch
  • A review late afternoon

None of these is outrageous on its own. Together they slice the workday into short fragments and make it much harder to reach the 2 to 3 hour focus windows that real progress depends on.

We recommend that leaders treat focus time as a team-level KPI, on par with throughput and quality:

  • Track focus percentage and absolute hours per week by team and role.
  • Protect focus windows by default, for example, morning “maker time” blocks.
  • Manage eroding focus as a team-level capacity problem to solve.

This lines up with what many thought leaders now argue: in knowledge work, the conditions for output (the ability to concentrate) matter as much as the output itself.

Teams are moving from measuring attendance and online time toward measuring the quality of attention.

So don’t leave deep work to luck. Make focus visible, set realistic benchmarks by role, and design your weekly rhythm so high-quality attention becomes routine.

Trend 3: The triple-peak workday—real, rare, and worth managing

Daniel Pink’s work on timing shows that most people move through three daily stages: peak, trough, and recovery. A triple-peak day stretches those three stages into something more intense:

  • Peak 1: a strong focus window in mid-morning
  • Peak 2: another push after lunch
  • Peak 3: a smaller third surge after dinner

Across all Hubstaff data, about one in five weekdays shows a triple-peak activity pattern.

Compared with a typical weekday, a triple-peak day is almost like running two workdays in one:

triple-peak-workday.png

Fewer meetings, fewer pings, and more total focus help explain why people push some work into the evening. They’re reclaiming uninterrupted time they can’t find between 9 and 5.

There’s a cost, though. Unproductive time creeps up to 3% from 2%, because you can’t double the length of a workday without adding some drag.

Triple-peak days run intense, and they don’t hold up well as a default pattern.

Used well, that evening peak is a deliberate trade-off. Someone blocks out 3 to 6 pm for school pickup, a workout, or errands, then logs back in after dinner to do deep work in peace.

That’s flexibility working as intended, with work and life in sync and timing matched to each person’s natural energy. It’s the kind of autonomy Pink argues can boost performance when the timing fits the task.

Used badly, the same pattern turns into an infinite workday. People are online early, stuck in meetings through core hours, then quietly expected to catch up at night.

That always-on rhythm fuels burnout and erodes boundaries.

Handled with clear norms, the evening peak lets leaders support flexibility without sliding into an always-on culture.

Our take is simple: the third peak should stay optional.

Trend 4: Tool overload and context switching, the digital stack dilemma

Most teams are stuck in classic tool overload, spending more time toggling between tools than moving work forward.

Harvard Business Review’s “toggle tax” study put numbers on it: digital workers toggled between applications and websites nearly 1,200 times per day, spending almost 4 hours per week, about 9% of working time, reorienting after each switch.

Every ping, notification, and alt-tab comes with a “toggle tax” on your attention.

Those studies suggest context switching can cost teams up to 40% of their productive day once you add in refocus time, decision fatigue, and errors.

By role and workstyle, average apps per day:

  • Office-based teams: 23 apps per day.
  • Marketers: 24 apps per day.
  • SEO specialists: 36 apps per day.

Fewer tools aren’t automatically better, since specialized roles will naturally use more. It's still worth keeping an eye on app counts:

  • Extreme app counts are a useful signal of fragmentation.
  • When app counts spike without a clear reason, like a new role or product, focus often falls.

Atlassian’s State of Teams 2025 echoes this, showing that teams waste around a quarter of their workweek searching for information, and that the strongest performers rely on a clear "system of work": shared goals, connected processes, and a single source of truth.

The move here is to streamline your digital spine. Aim for a coherent setup rather than the bare minimum number of tools:

  • A small set of “source of truth” tools for work (docs and tasks), communication (chat and video), and knowledge.
  • Clear “tool-for-what” rules so people know where to put work and where to find it.
  • Integration and automation that reduce duplicate entry and context switching.

Hubstaff’s angle is connecting apps/day directly to focus time, which turns an abstract worry into something you can act on:

  • Compare a team’s focus share and after-hours work to similar teams with leaner stacks.
  • Identify teams in the top decile of app usage.
  • Use that gap to prioritize consolidation, integration, or clearer norms.

Fewer, smarter tools and clearer defaults usually mean better focus and higher throughput. An overgrown app stack costs you focus time.

Trend 5: AI at work, 2026 is the year of action

The first question for any team is whether you’re actually tracking AI use or just assuming it’s happening. With Hubstaff, you can now see how AI is being used across your team through the AI Tools feature.

In our AI Productivity Shift research, 2024 data showed that 67% of Hubstaff users used AI at work, yet it accounted for only 4% of their tracked time.

The companion survey told a similar story: most workers said they used AI, usually in short, occasional bursts.

By 2025, the share of Hubstaff users on AI tools rose from 65% to 73%, while the share of total tracked time in AI apps slipped from around 4% to 3%.

More people are using AI, though for most it’s still a helper they tap a few times a day.

That tracks with McKinsey, whose 2024 global survey found that nine in ten employees use generative AI for work, even though only 13% considered their organization an early adopter.

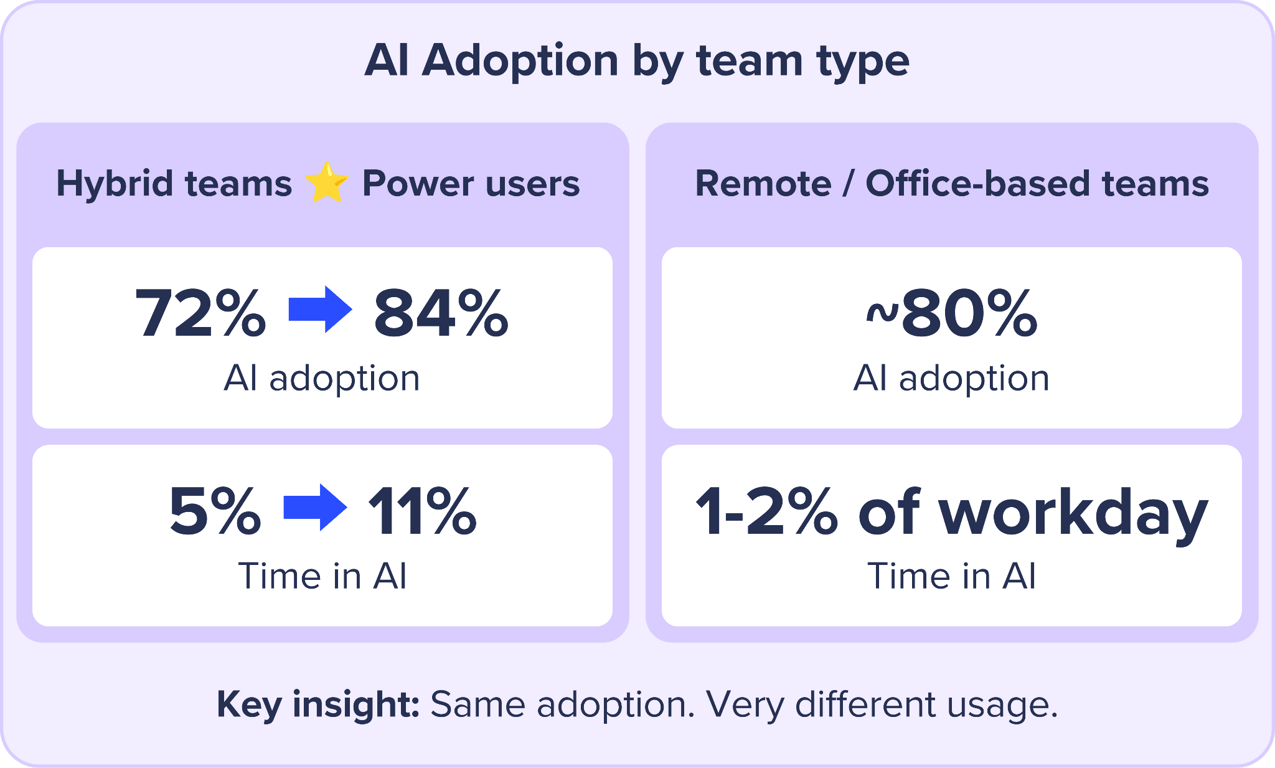
Hybrid teams are the clearest power users. Their adoption climbed from around 72% to 84%, and their time in AI tools jumped from about 5% of the workday to roughly 11%.

Remote and office-based teams also reach around 80% adoption, yet they spend only 1 to 2% of their day in AI apps.

Hybrid teams have gone past trying AI and started rebuilding workflows around it.

AI adoption by team type

By role, engineers lead, with 87% using AI for about 8% of tracked time, roughly double what we saw a year earlier.

Most other roles, including support, sales, operations, HR, finance, and customer success, sit in the high 70s to low 80s for adoption but spend only about 2 to 3% of their time in AI.

For them, AI handles a quick draft, a summary, or a better email, and it hasn’t moved into the core of the work yet.
ai-adoption-by-team-type-2.png

Regionally, APAC and EMEA have pulled ahead. Around 81% of workers there now use AI, compared with around 60% in North America and just under 70% in Latin America.

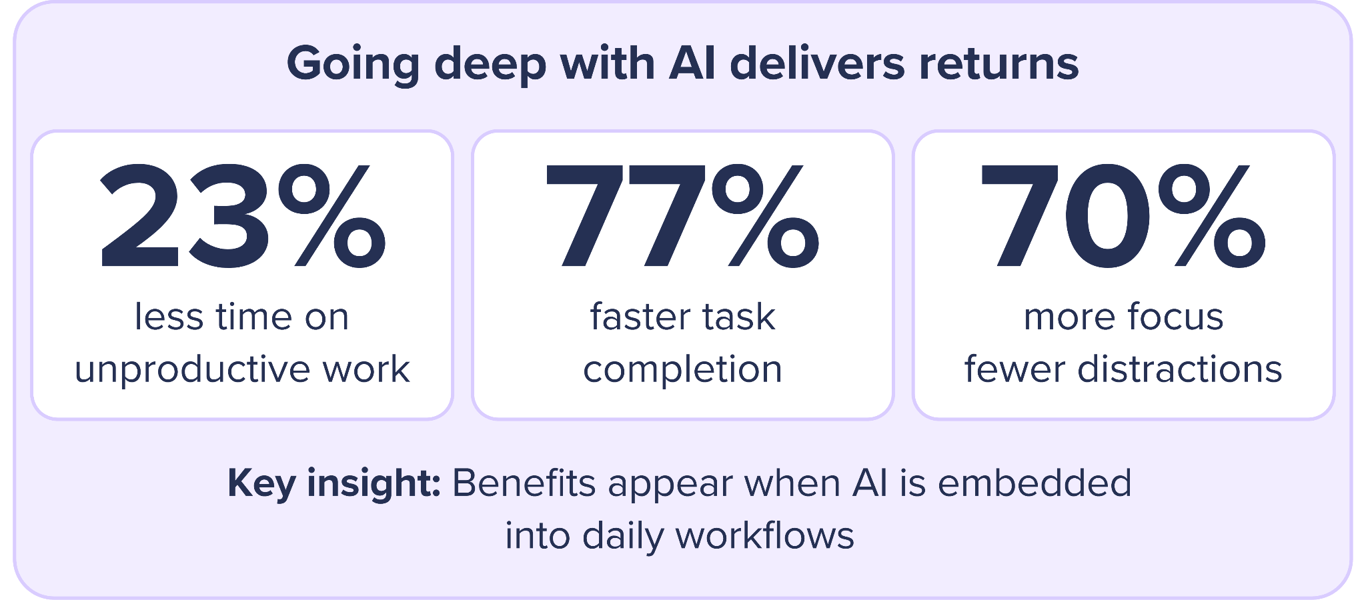
Depth matters because of the returns it unlocks. In our AI Productivity Shift report, the teams that went deeper saw clear gains:

  • 23% less time on unproductive work
  • 77% faster task completion
  • 70% reported more focus and fewer distractions

Those gains show up when AI is embedded into daily workflows.
going-deep-with-ai-delivers-returns-2.png

Most of the world has figured out AI adoption, so the next race is integration.

2025 was the year of experimentation, and 2026 has to be the year of action: fewer pilots, more real workflows, clearer policies, and visible outcomes.

Here's what this looks like in practice:

  • Start in the bottlenecks: summaries, drafting, ticket triage, research, and reporting.
  • Turn early wins into shared workflows instead of endless new pilots.
  • Give managers guardrails, training, and a few simple metrics, including AI hours, team adoption, and changes in cycle time and unproductive time, so they can see where AI is moving the needle.

Those steps take a team past everyone using AI somewhere and into AI doing a real, measurable share of the work.

Trend 6: Capacity planning, using utilization and hours as an early warning system

Capacity planning is shifting from a quarterly resourcing task to something teams watch week to week. The question worth asking is who's working at a sustainable load and who's consistently over it.

Among people who logged more than 50 hours a week:

people-who-logged-more-than-50-hours-week.png

From a capacity planning view, this is an early red flag. The load isn’t evenly spread, and certain roles and functions run systematically over capacity.

Here’s why 50+ hour weeks read as a capacity problem worth fixing:

  • A Stanford analysis shows that output rises at a steadily decreasing rate beyond about 48 to 50 hours a week, with extra hours adding little to total output.
  • The World Health Organization links 55+ hour work weeks to a 35% higher risk of stroke and 17% higher risk of heart disease versus a 35 to 40 hour work week.

Ignore those limits while planning capacity, and you erode performance instead of maximizing it. Treat 50+ hour work weeks as a danger threshold.

Burnout is the most visible consequence, and it isn’t the only one. Overload also drives more rework, slower decisions, and higher attrition.

Our role-level view highlights where capacity breaks first:

  • Managers, sales, support, and other client-facing roles see more frequent 50+ hour weeks.
  • Engineering and similar maker roles keep hours more balanced on average.

For capacity planning, this matters more than company-wide averages. It tells you:

  • Where to intervene first, often middle management and customer-facing teams.
  • Where to add headcount or redistribute work.
  • Where to borrow playbooks from healthier teams, like clearer boundaries, on-call rotations, and better handoffs.

Capacity planning works when it combines hours, utilization, focus, and burnout risk into one view. Leaders can then adjust demand, staffing, and expectations while there's still room to move.

4 strategies for leaders in 2026

Each strategy below turns the trends and benchmarks into concrete moves for global leaders over the next 6 to 12 months.

1. Design a fair global work rhythm for focus and collaboration

Your global team’s work rhythm matters. Hubstaff data shows focus time is the scarcest resource, triple-peak workdays run real but intense, and hybrid teams often have the lowest focus share.

To protect focus time and keep collaboration fair across time zones, design a clear global work rhythm.

Using the Hubstaff Global teams’ time zone overlap playbook, turn your overlap rule into specific UTC windows and local-time bands for each hub. The matrix shows who should join live, who should stay in deep work, and when to default to asynchronous handoffs.

Here's how to put this in place:

  1. Set one primary overlap window per global team. Define a 2 to 4 hour daily overlap window for real-time collaboration like standups, decision meetings, and complex discussions. Outside that window, default to async. For teams spanning many time zones, rotate the overlap so the same region isn’t always paying the “unfriendly hours” tax.
  2. Protect local maker mornings by default. Make the first 2 to 3 hours of the local workday meeting-free for most roles, especially high-focus ones.
  3. Codify after-hours norms and triple-peak expectations. Make it explicit that evening work and triple-peak workdays are an opt-in flexibility option that nobody is required to take on.
  4. Create written team agreements for work rhythms. Publish a one-pager covering office days (if applicable), core hours, overlap windows, and how to handle cross-time-zone collaboration.

You’ll know it’s working when:

  • Average focus time per person rises.
  • Meetings per person hold steady or drop, especially in the morning.
  • Team pulses and 1:1s show clearer work-life boundaries and more satisfaction with how time zones and unfriendly hours get shared.

2. Run capacity and wellbeing as a repeatable system

Your team’s capacity and well-being are properties of the system rather than a test of individual willpower. Hubstaff data shows 50+ hour weeks are common for managers, sales, and support roles.

World Health Organization and Stanford research show that beyond roughly 48 to 50 hours a week, you trade health and long-term performance for very little extra output.

For sustainable performance, run capacity planning and wellbeing as a repeatable system that catches problems before people burn out:

  1. Make 50+ hour weeks an automatic review trigger. Set simple rules in your dashboards: if anyone logs a 50+ hour week, their manager reviews workload, priorities, and staffing in the next sprint. If a team shows repeated 50+ hour weeks, escalate the pattern to a leadership review.
  2. Protect local maker mornings by default. Make the first 2 to 3 hours of the local workday meeting-free for most roles, especially high-focus ones.
  3. Plan for known peak periods. For launches, seasonal spikes, or major projects, plan for the extra load in advance: pause lower-priority work, expand on-call rotations, and set explicit end dates for the surge. Skip "we'll just stretch" as a default operating model.

You’ll know it’s working when:

  • The share of people with recurring 50+ hour weeks falls, especially in manager, sales, and support roles.
  • Focus percentage holds or improves during busy periods instead of collapsing.
  • Sick leave, stress-related attrition, and burnout signals in pulses drop in the hotspots you flagged earlier.
  • Managers can point to clear rescoping and resourcing decisions made from capacity data, rather than “we pushed through and hoped for the best.”

3. Streamline your tool stack to cut tool overload and context switching

Your tool stack can either support focus time or eat into it. Hubstaff’s apps/day metrics and focus data show that teams with very high tool counts spend more time in messaging and coordination and less in deep work.

Harvard Business Review’s “toggle tax” has ICs losing roughly four hours a week, nearly 10% of working time, just to context switching.

To reclaim that time, streamline your tool stack and build a clear digital spine that reduces overload.

  1. Build a simple “tool-for-what” map. For each team, list your core work categories (communication, projects, docs, knowledge, tickets) and agree on a single default tool for each.
  2. Add it to onboarding. Upgrade onboarding so it teaches workflows alongside tools. Walk new hires through your “tool-for-what” map: where requests start, where work is tracked, where decisions live, and where final outputs are stored.
  3. Add a gate for app purchases and renewals. Create a simple approval process for any new app: what problem it solves, who owns it, who will use it, what it replaces or overlaps with, and how you’ll measure success. Route requests through a single owner (operations, IT, or finance), link approvals to clear “no-duplicate-tools” rules, and require a quick 90-day check-in before renewal to decide whether to keep, consolidate, or cut.

You’ll know it’s working when:

  • Median apps/day holds steady or falls, especially in teams that struggled with overload.
  • People report fewer “Where is that doc?” or “Which app is this in?” moments.
  • Focus time percentage rises where you’ve simplified the stack.
  • New hires onboard faster because they can follow workflows and find information quickly.

4. Turn AI adoption into AI workflows with a real co-pilot

AI adoption only matters when it changes workflows. Hubstaff’s data shows AI usage growing quickly, with more active users, more AI hours per user, and much higher total AI hours in just a few months.

To get real value, move from ad hoc experiments to AI workflows, where AI acts as a co-pilot in how your team actually works:

  1. Pick 3 to 5 high-impact AI use cases per function. For each function, choose specific workflows: marketing for first-draft creation and content repurposing; support for auto-summaries, responses, and ticket tagging; engineering for test generation and documentation; finance for variance explanations and basic analysis.
  2. Appoint AI champions and a small enabling team. Nominate AI champions in each function who run experiments, share prompts, and document what works. Pair them with a central enabling team that owns AI policy, vendor decisions, and guardrails so managers feel safe encouraging AI usage.
  3. Treat AI literacy as a core skill. Offer role-based AI training covering prompts, critical evaluation of AI outputs, and safe data use. Make “how we use AI here” part of standard onboarding, manager training, and recurring enablement, beyond a one-off webinar.
  4. Bake AI into workflows and templates. Embed AI directly into your SOPs: include recommended prompts in templates, add “AI draft or AI analysis” to checklists, and define review steps so humans stay in control. Aim for AI to be the default co-pilot in the specific workflow steps people rely on.

You’ll know it’s working when:

  • AI usage and adoption climb while cycle times and manual steps drop.
  • Teams spend less time on repetitive, low-value work and more on decisions, strategy, and creativity.
  • Managers can point to specific processes where AI has changed how work gets done.

Rewiring work for 2026 and beyond

The six trends point to one idea: design how work happens instead of asking people to push harder.

For 2026, that comes down to a short list for leaders of global and distributed teams:

  • Design a fair global rhythm.
  • Treat focus time as a KPI.
  • Cut tool overload and context switching.
  • Turn AI pilots into AI workflows.
  • Treat 50+ hour weeks as a system failure.
  • Make these metrics part of your operating cadence.

This Global Work Index, the Benchmarks Pack, and the Global Teams Operating Standard give you a place to start. The rest is designing how your team works, on purpose.

Methodology

This playbook distills durable patterns seen across 140 thousand global team members using Hubstaff.

Core definitions (time-use and stack)

  • Focus time. Uninterrupted productive activity inside work apps long enough to make progress, beyond fleeting active-window seconds.
  • Messaging time. Time in chat and email clients.
  • Productive app %. Share of time inside the apps that materially move work forward for a given role or team, as tagged in our app taxonomy.
  • Meeting time. Time in calendared blocks plus confirmed conferencing-app usage.
  • Apps/day. Distinct work apps touched per day
  • Meetings/week (count). Average number of scheduled meetings attended per person per week.

Rhythm and timing metrics

  • Most productive days of the week. Distribution of total focus minutes and hours across Monday to Sunday.
  • Most productive hours of the day. Distribution of focus minutes by local hour (00:00 to 23:59).
  • Triple-peak day prevalence. Proportion of days showing three distinct focus peaks (morning, afternoon, evening) separated by troughs.
  • Start-time distribution. Share of people whose first tracked work activity occurs in dawn, morning, afternoon, or evening local-time bands (see verification for band cut-offs).
  • AI app usage over time. Time spent in AI-tagged apps and the share or number of users with AI-app activity, trended across periods.
  • >50-hour week prevalence (burnout signal). People-level: percentage of individuals with at least one week exceeding 50 tracked hours. Week-level: percentage of all observed person-weeks exceeding 50 tracked hours.

Data quality and privacy: All figures are aggregated, and no individual, team, or customer is identifiable in this report.

See how it works for your team

Book a strategy session with Hubstaff, and we’ll plug your team’s data into the same lenses you’ve seen in this report: focus time, meetings, app overload, AI usage, and more. Walk away with a clear view of how your team actually works today and the biggest opportunities to redesign work for 2026.