Using Data to Improve Team Productivity: Strategies from High-Performing Remote Teams

 7 min read
- Remote work is here to stay — 98% of U.S. workers want it — but it only works long-term when leaders track the right metrics like focus time, utilization, and engagement.
- Teams spending 40%+ of time on non-core tasks risk disengagement and inefficiency, making workload visibility essential for sustaining healthy, high-performing remote teams.
- Hubstaff turns productivity data into action — giving leaders real-time insight into bottlenecks and workload balance while giving employees the autonomy and support they need to thrive.

Remote team productivity has been under scrutiny since the start of the 2020s. But how often do teams respond to criticism and look to improve team productivity with data?
Companies that pivoted to remote work models during the pandemic have largely stayed the course — and with good reason. According to Forbes, 98% of U.S. team members want the option to work remotely at least part of the time.
But is wanting to work remotely enough of a reason to allow employees to do so?
Productivity in remote teams can easily slip through the cracks. That’s why the shift to remote work has made one thing clear: productivity tracking in remote teams isn’t optional — it’s essential.
However, the real challenge lies in determining how to measure the productivity of remote employees and use data to gauge efficiency strategically.
Hubstaff’s Workstyle Revolution Report anonymized data across 22,000 organizations and 185,000 team members. The report outlines key insights on focus time, task breakdowns, and performance trends in remote environments.
From this report, we uncovered employee productivity metrics and key performance indicators (KPIs) that can help, including:
- Task completion rate
- Team utilization
- Focused work sessions
- Results-driven work
In this post, we’ll break down more key productivity metrics remote teams should track, what each metric reveals, and how to use them to optimize team performance and efficiency.
Let’s get started.
1. Focus time: Your team’s deep work indicator
Ever feel like you’re not really locked into the flow state at work? At Hubstaff, we’ve felt this feeling before. Enter a term we like to call focus time.
Focus time refers to uninterrupted attention to a specific project or task for at least 30 minutes. This can be an excellent time management strategy for tracking deep work (or work that requires more cognitive attention than most) like writing or research-based projects.
Focus time analytics can ensure team members understand the average number of focused sessions your teams complete in a given time frame. If meetings are cutting into too much of an individual’s focus time, you can make adjustments to prevent overwork and burnout.
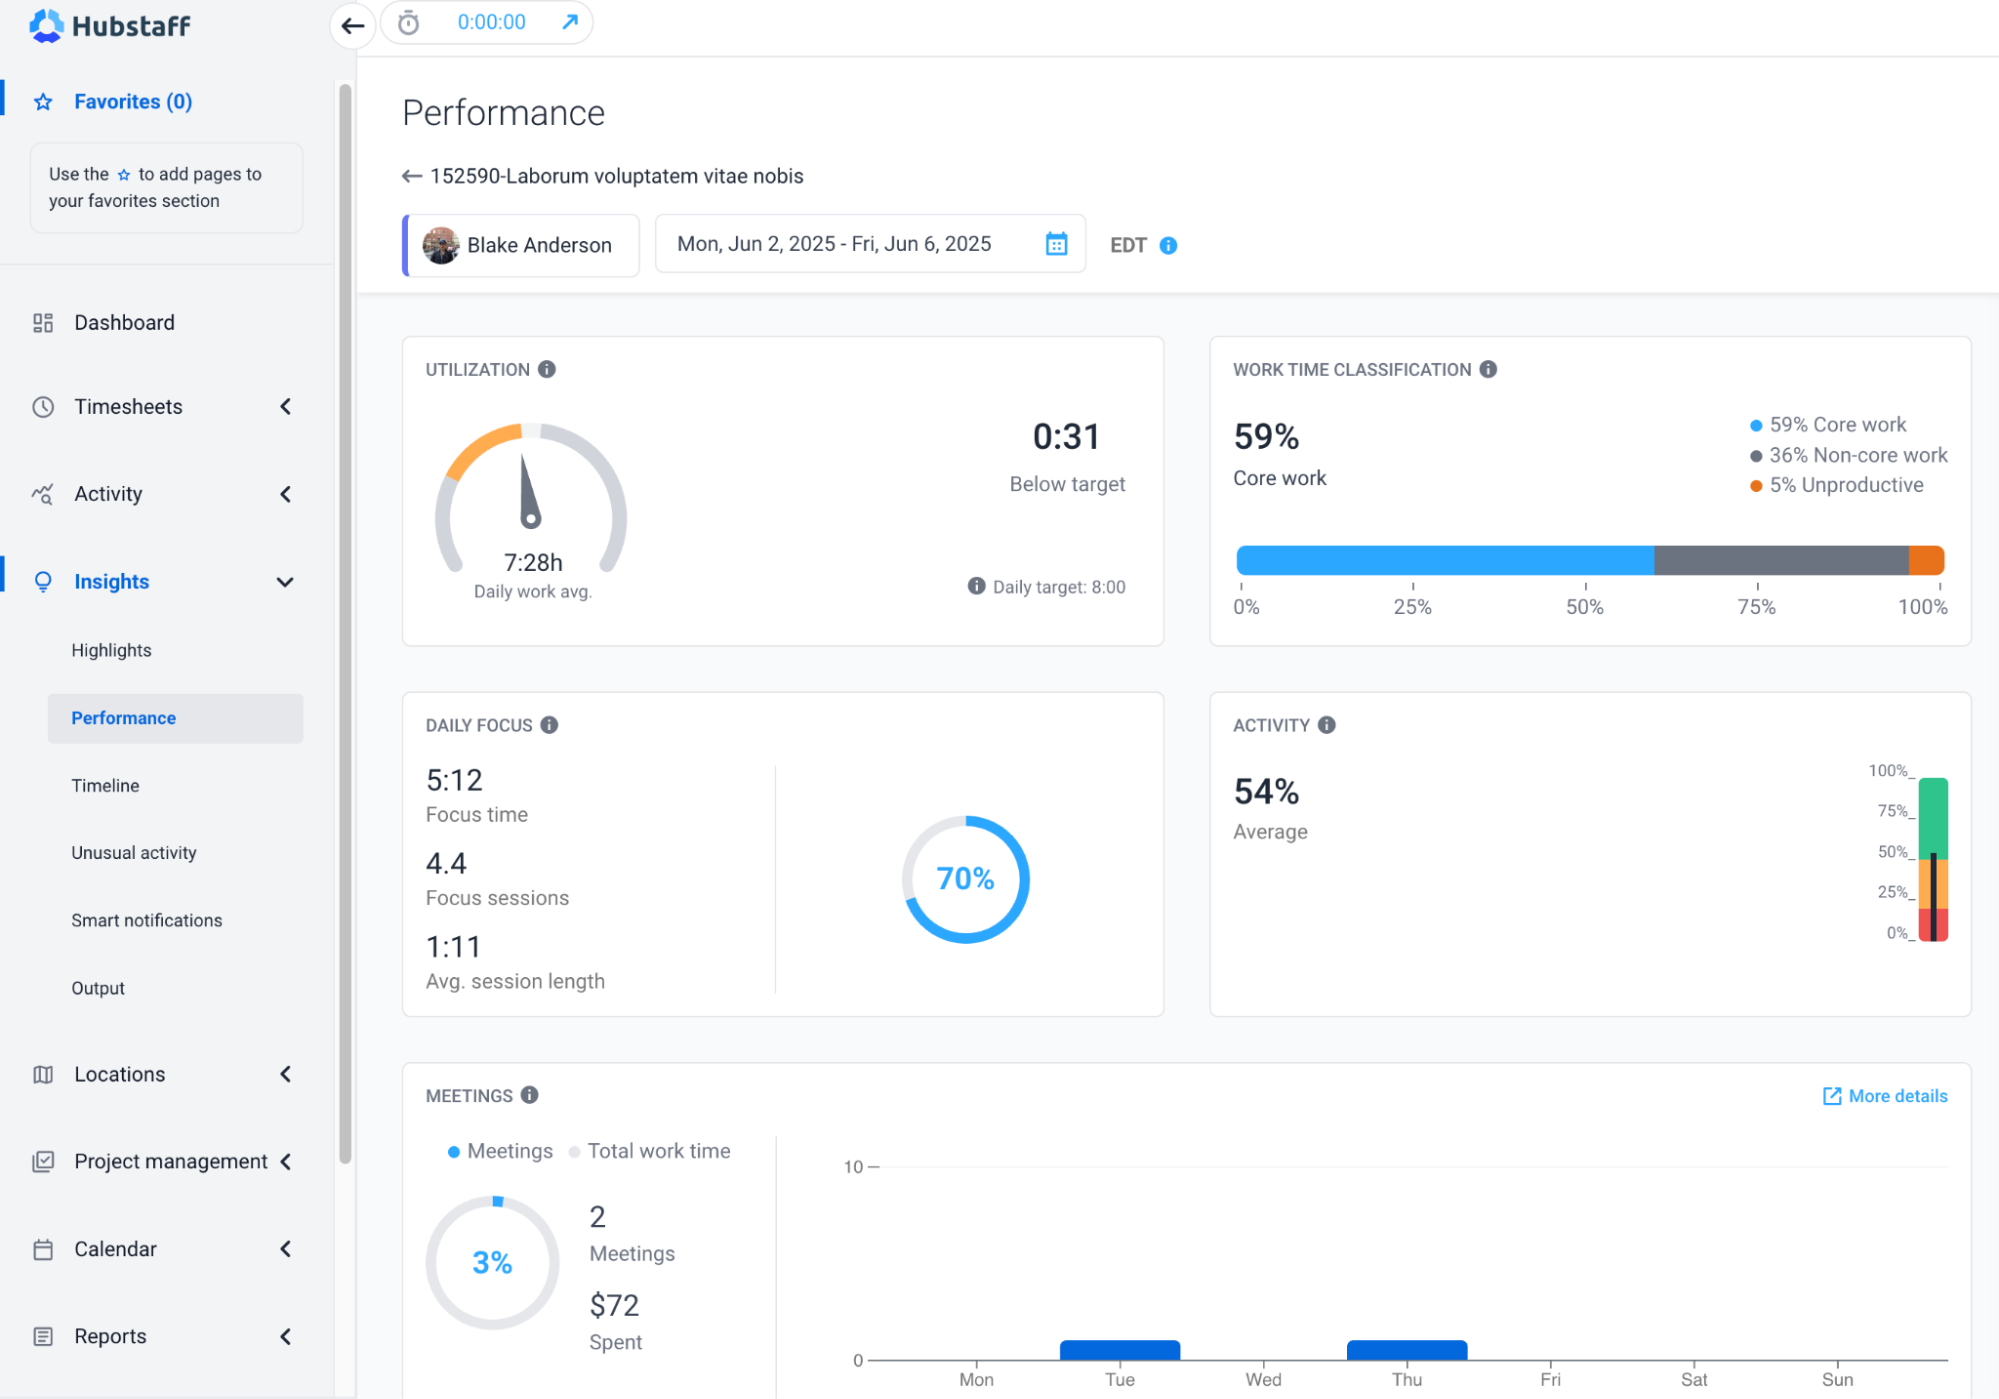
Time tracking software platforms with integrated workforce analytics, like Hubstaff, help organizations measure deep work across teams. By tracking focus sessions lasting 30 minutes or longer, leaders can benchmark focus time by role, compare team performance, and uncover opportunities to improve productivity without relying on assumptions.
Website and application activity complements focus-time analytics by providing the context behind work patterns, enabling leaders to identify trends, benchmark teams, and make data-informed workforce decisions.
2. Unproductive time: Spotting bottlenecks and burnout
Unproductive time refers to non-focused time wasted on non-work-related activities. Employee productivity software can spot potential bottlenecks by looking at data like:
- Low activity rates
- Frequent switching between tasks
- Significant portions of idle time
- Increased time spent on unproductive apps and URLs
Unproductive activities could stem from unclear expectations, lack of processes and priorities in place, or just out of pure distractions. It can also be a result of time wasters like excessive meetings, multitasking that doesn’t add value, and other issues.
Hubstaff’s time tracking data shows work time classifications based on productive and unproductive work. By analyzing data like this, you can see how much time employees spend on websites and apps categorized as productive or unproductive.
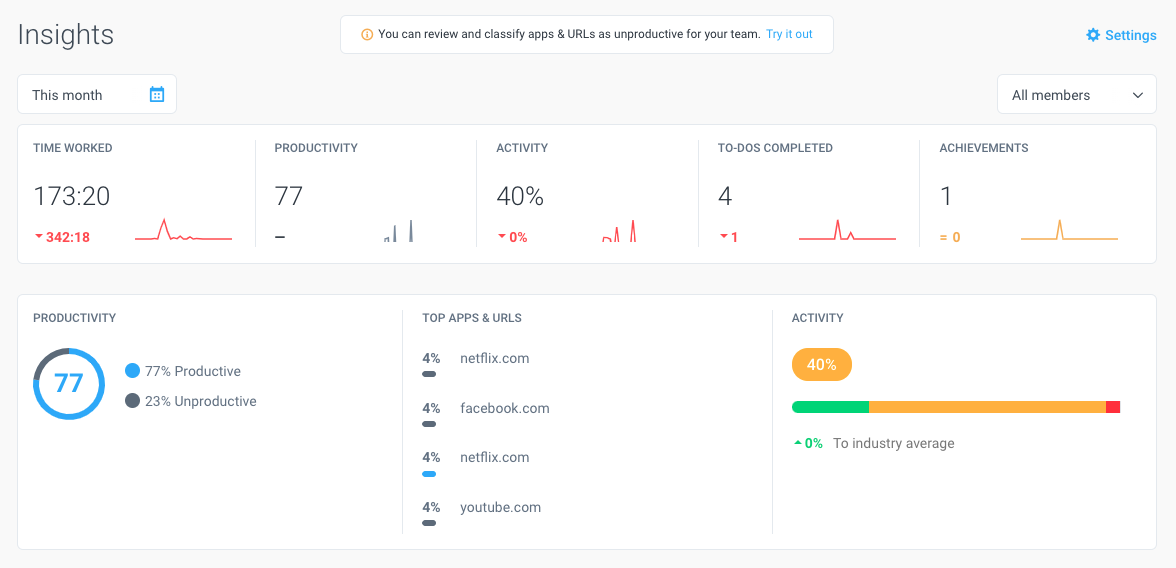
For example, suppose you see an unusual amount of time spent on social media sites during work hours. Unless the individual is someone from your marketing team, such as a social media manager, it’s data worth keying in on.
In that case, this is a sign of wasted time. Such specific data can help pinpoint hidden inefficiencies and bottlenecks and save businesses from unwanted overtime costs and employees from potential burnout.
3. Core work time: Measuring what moves the needle for continuous improvement
Core work time is a term we came up with to identify the time spent on job-specific, high-priority tasks. Core work differs based on the responsibilities laid out by one’s manager and job description.
For example, a developer’s core work involves coding, while a content creator’s involves writing. There may be some overlapping responsibilities between these roles (e.g., a writer who also publishes pages and makes coding tweaks), but each has its own primary job responsibilities.
Core work is different for every position, but tracking it is crucial. It helps managers optimize utilization rates by delegating work to the team members who are most likely to complete it efficiently.
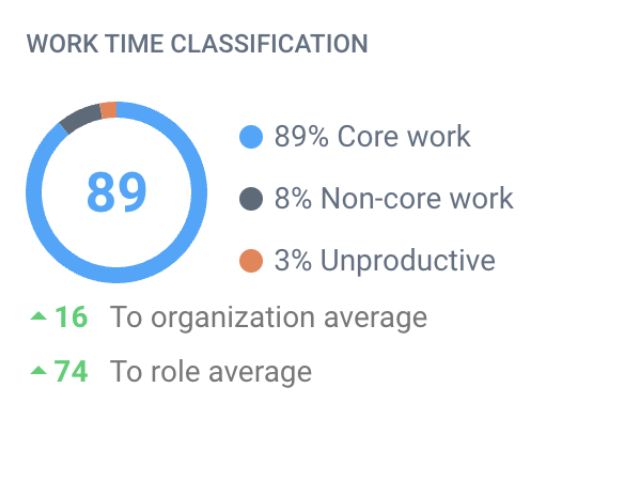
With worktime classifications, you can see the percentage of core work vs. non-core work and time wasted on unproductive tasks. This is a great way to get a high-level overview of how your team utilizes their work hours to better benchmark productivity and performance.
4. Non-Core work time: Identifying admin and low-impact tasks
Non-core work is any activity that extends beyond an employee’s primary job responsibilities but is still part of their workload. To refer back to the example above, a content writer’s core work is to write, but non-core work might involve time spent publishing that content. There are also non-core work items that would extend to almost any job role, including back-and-forth emails, meetings, or Slack catch-ups.
Whether it’s job-specific or general, you can find the perfect balance between core and non-core work by tracking productivity with Hubstaff. Like with core work, non-core time can also be classified into specific URLs and apps to address potential inefficiencies.
It’s important to note that these non-core work items are still essential components of an employee’s daily work hours. However, we’ve found that if teams spend over 40% of their time on non-core tasks, it can hurt employee engagement and lead to inefficiencies.
5. Utilization: Actionable insights on who’s overloaded or underused
Utilization rate is a key performance metric that helps team leads understand how effectively their employees’ time is being used, especially for workload distribution and preventing overworked team members from burnout.
It measures the ratio of hours worked (typically out of an 8-hour day) and can be tracked as either billable vs. non-billable time or planned vs. actual hours.
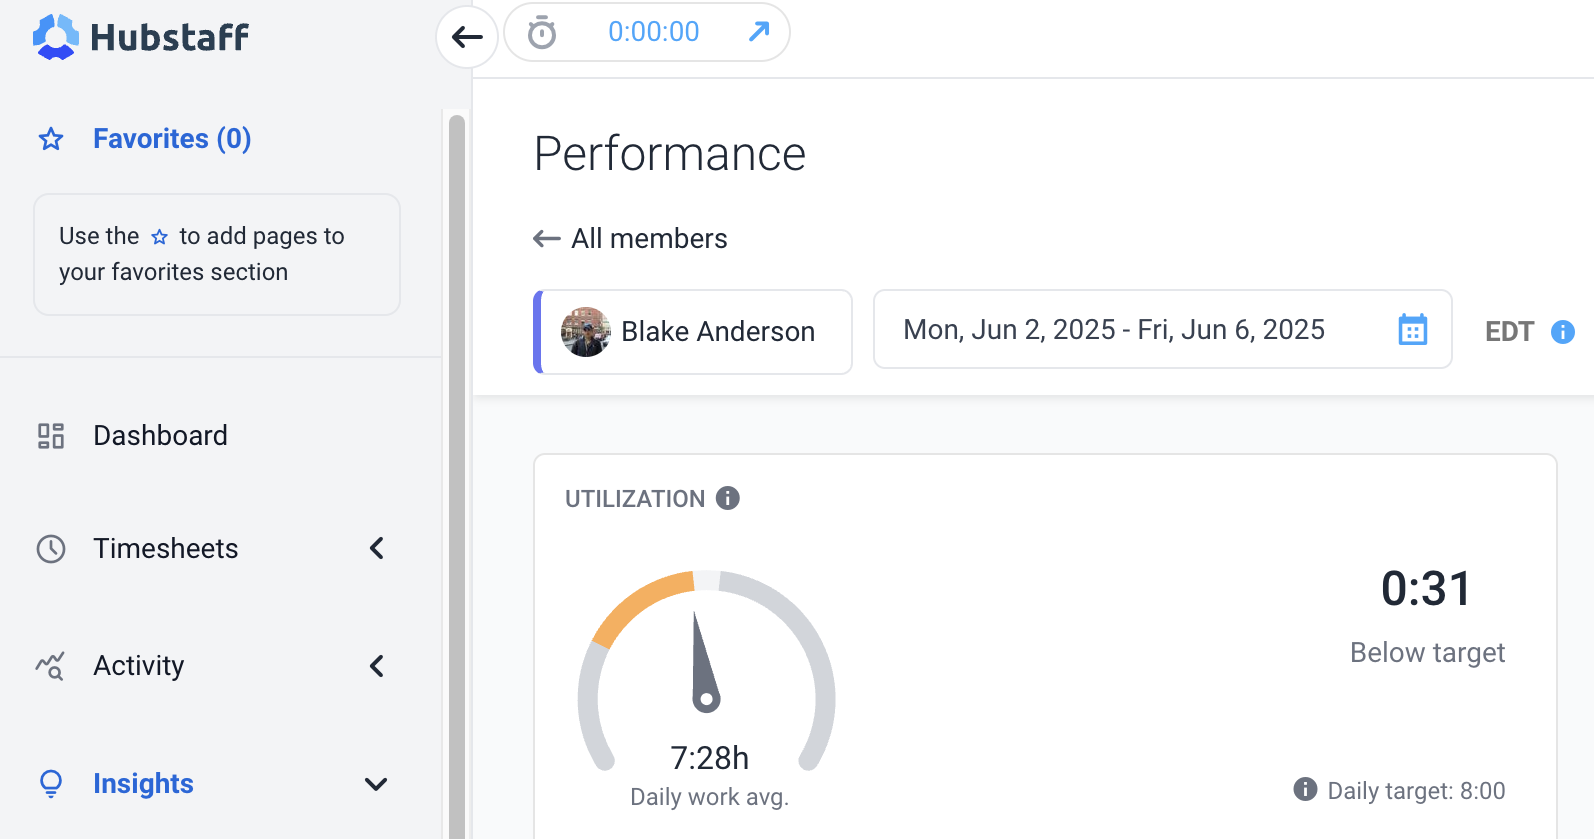
A 100% utilization rate means an employee is fully booked — but that doesn’t always equate to sustained productivity. In fact, it can lead to burnout or be a sign of unusual activity to see activity and utilization rates that are so high.
By analyzing data on employee utilization metrics, managers can redistribute tasks, prevent overload, and ensure resources are aligned with high-impact priorities.
Hubstaff’s productivity dashboard perfectly captures utilization rates, showing if your team members are over or under target for the day.
6. Engagement data insights: Beyond hours worked
Engagement goes deeper than just time logged or tasks tracked. The real question is how invested your team members are in their work.
While someone may appear “busy,” true engagement is reflected in behavioral indicators like:
- Consistent time-on-task
- Voluntary overtime
- Communication patterns
- Noticeable drop-offs in activity or responsiveness.
These signals help leaders differentiate between genuine productivity and surface-level busyness.
While employee pulse surveys can also capture sentiment, job satisfaction, and motivation trends, they empower leaders to foster psychological safety, boost meaningful engagement, and create a positive team culture when monitored together.
The activity levels feature lets you know exactly how productive you or your team are when tracking time. You may use this data to address team efficiency on the spot quickly. When your team tracks time with Hubstaff, the activity rate metric is calculated based on the percentage of keyboard and mouse strokes in a specific time period.
Choosing the right tool to track team productivity metrics for data-driven decision-making
Tracking all this valuable data manually would be a nightmare (and would likely result in inaccurate data quality).
Time tracking for remote teams is like keeping a shared recipe book in a busy kitchen. Each chef is contributing to a complex meal, and without a recipe book where each chef notes their contribution and how long it takes, the meal wouldn’t taste good and be ready on time.
Similarly, without a powerful time tracking tool that helps team members track time for tasks and provides actionable insights, you wouldn’t know how to improve team productivity with data, optimize workflows, hit team goals, or reward good performance.
The best productivity tools for remote teams include features that help you track productivity to the most granular level. Analyzing this data lets you identify the subtle difference between productivity and efficiency and make data-driven decisions.
So, when choosing a productivity monitoring tool, make sure to look for an all-in-one time and productivity tracking solution that captures team dynamics like:
- Focus time
- Unproductive hours
- Core work tasks
- Team utilization
Time tracking software platforms with built-in productivity monitoring and workforce analytics layer, like Hubstaff help with all the metrics above to give you a 360-degree view of your team’s productivity patterns and helps you improve team productivity with data.
Beyond individual productivity metrics, Hubstaff’s workforce analytics helps leaders understand broader patterns across teams and turn those insights into action. With Hubstaff, you can:
- Compare remote and in-office work patterns using data such as hours worked, activity, idle time, start and stop times, and core work.
- Detect unusual activity and use Smart Notifications to surface anomalies, potential overwork, low engagement, or inconsistent activity patterns.
- Use utilization, focus time, meeting time, attendance, and historical workload data to identify capacity gaps and rebalance work.
- Use Hubstaff’s API, CLI, and MCP server to let developers, power users, and AI tools query workforce data, automate analysis, and build custom workflows.
Improve team productivity with data analytics
Data-driven productivity goes a long way when done right. That’s why we’ve arrived at productivity metrics like:
- Focus time
- Core work
- Non-core work
- Utilization
- Employee engagement rate
These metrics are not designed to support micromanagement but to give employers and employees clarity, help decision-making, and boost team efficiency.
The right collaborative tools and productivity metrics help leaders track progress, improve team dynamics, make smarter decisions, rebalance workloads, and identify bottlenecks and growth opportunities.
Utilizing tools and tracking work is the starting point of building a culture of continuous improvement, effective team collaboration, and purposeful performance. For employees, this means autonomy, improved team morale, and support where it matters most.
Most popular
The AI Productivity Panel: Lessons From Leaders on What’s Working (and What’s Not)
When I moderated this AI productivity panel, I expected a solid conversation. What I didn’t expect was the flood of real-world i...
Ask Your Workforce Data Anything with Hubstaff’s New AI-Ready CLI and API
It’s Monday morning. Your CEO asks, “Which projects went over budget?” Instead of pulling reports, exporting numbers, and ve...
How to Spot and Manage Work Overload Before Your Best People Burn Out
Work overload occurs when the demands placed on an employee or team exceed their available resources, leading to stress, burnout,...
Workplace Productivity Statistics in 2026: What the Numbers Say
For many businesses, having the ability to maximize output without compromising quality gives them a major edge over their competi...