Team performance metrics: How to measure and improve results with data
- Developers lose 23.5% of their workday to Slack and meetings before writing a single line of code — making automated time tracking essential for identifying and reclaiming lost productivity.
- Focus time makes up just 53% of the average workday, dropping to 46% for in-office teams — tracking five core metric categories helps surface these gaps before they become bigger problems.
- Hubstaff's real-time visibility, 20+ automated reports, and AI-powered anomaly alerts help teams shift from reactive fixes to proactive, trend-based performance improvement at scale.

“If you can’t measure it, you can’t improve it.” It’s a familiar phrase, but when it comes to team performance metrics, it’s more than just wisdom. It’s a warning.
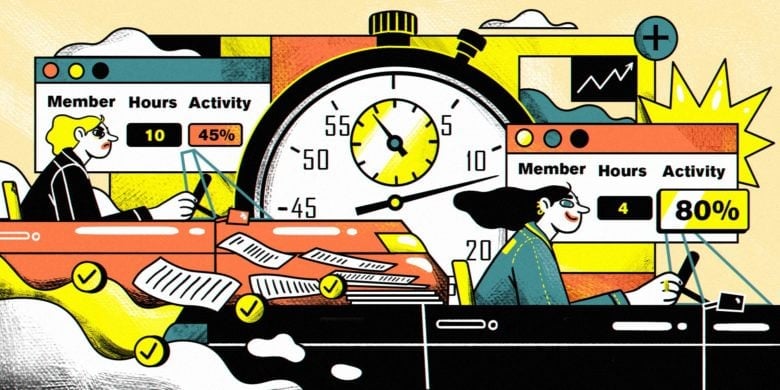
And the numbers tell the story. Based on aggregated, anonymized work patterns observed across teams, developers spend an average of 11% of their day in Slack and 12.5% in meetings. That’s nearly a quarter of their time gone before a single line of code is written—highlighting how collaboration time can quietly chip away at deep work time.
To make meaningful improvements, you need clarity on where time goes, how work gets done, and where the bottlenecks lie.
That’s where time tracking tools like Hubstaff can help with performance evaluation. With the right data and visibility, leaders can make smarter, fairer decisions about performance — focusing on outcomes instead of oversight.
In this article, we’ll break down the most critical team performance metrics, explain why they matter, and show you how to use them to drive measurable results.
What are team performance metrics?
Team performance metrics are quantifiable indicators that help assess how effectively a team is working toward its goals. In practice, measuring team performance means tracking output, efficiency, quality, and engagement over time — not evaluating individuals in isolation.
For example, if a sales team initiates 10 calls but only two result in conversions, the conversion rate becomes a key performance metric that reflects the team’s effectiveness. Rather than relying on assumptions, metrics give leaders tangible data to evaluate team efforts.
While individual employee metrics focus on personal output or behavior, team performance metrics assess how work flows across the group — including collaboration, efficiency, and overall results.
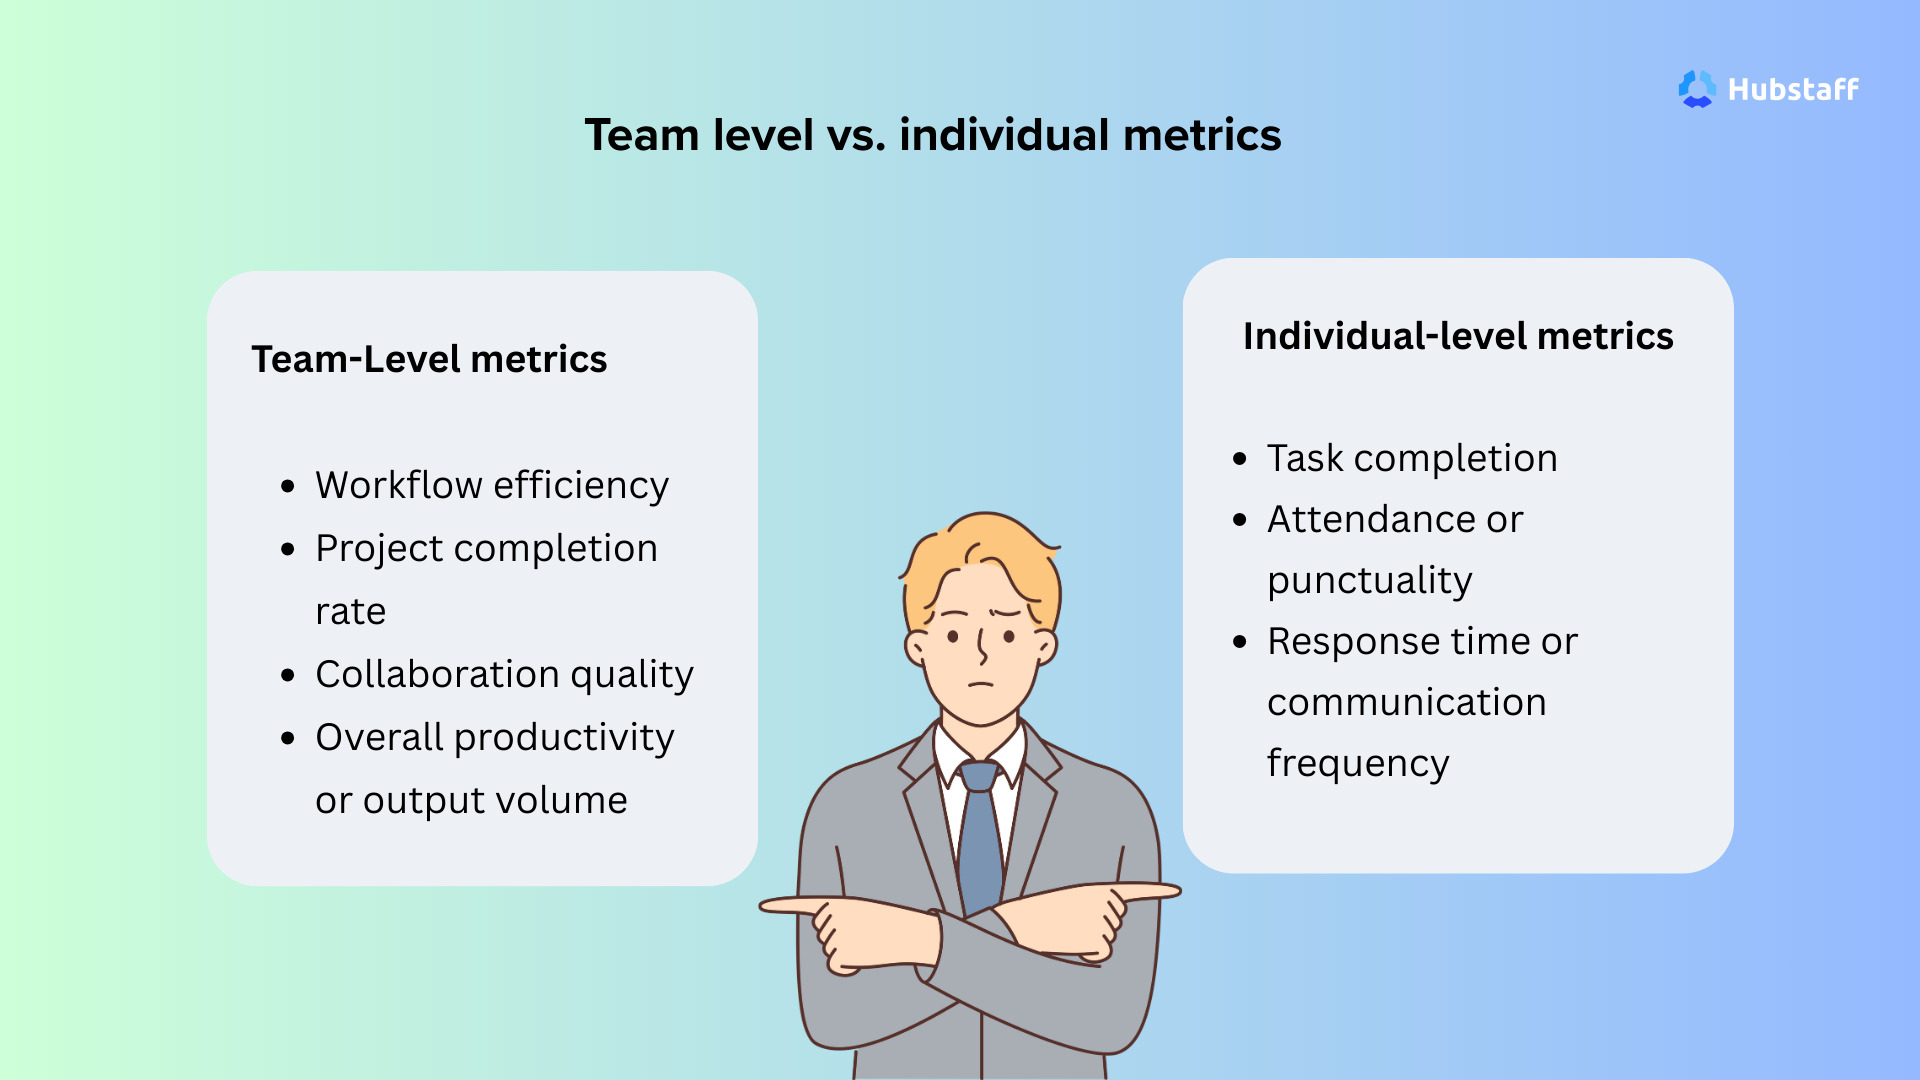
Key differences include:
Team-Level metrics
- Workflow efficiency
- Project completion rate
- Collaboration quality
- Overall productivity or output volume
Individual-level metrics
- Task completion
- Attendance or punctuality
- Response time or communication frequency
In the long run, team performance metrics enable organizations to track progress across projects or departments. Time tracking tools like Hubstaff support this by aggregating signals from tracked time, activity data, and task progress.
See Hubstaff in action
Watch our interactive demo to see how Hubstaff can help your team be more productive.
Why measuring team performance matters
Measuring team performance isn’t micromanagement — it’s how teams build clarity, accountability, and continuous improvement based on evidence rather than assumptions.
Without performance data, it’s hard to identify what’s working, where support is needed, and how efforts align with strategic goals.
Here’s what matters:
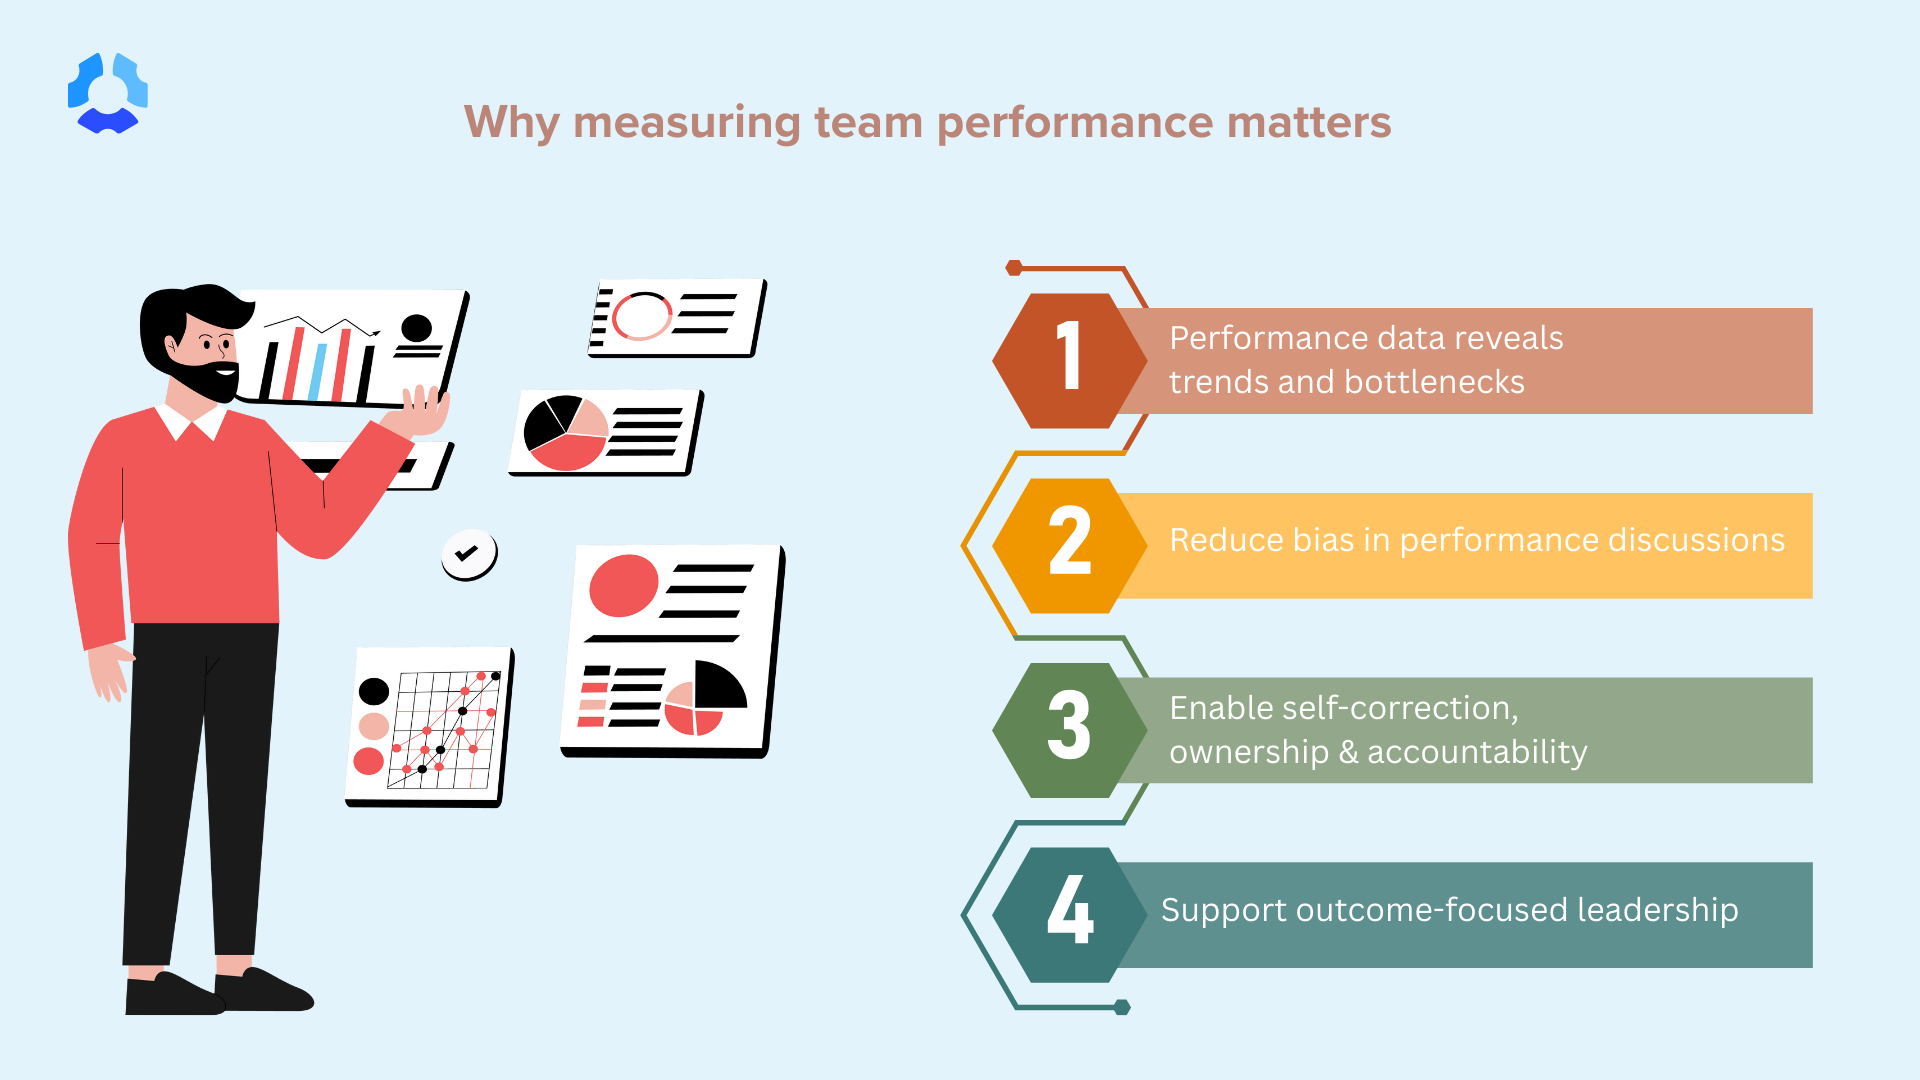
- Identify patterns before problems arise: Performance data reveals trends and bottlenecks early, enabling you to address issues proactively.
- Reduce bias in performance discussions: Data provides an objective foundation for evaluating team members, reducing reliance on gut feelings or favoritism.
- Enable self-correction: When teams see their own progress, they naturally adjust and improve, leading to ownership and accountability.
- Create visibility, not surveillance: Transparency builds trust. Seeing the big picture matters more than monitoring every move.
- Support outcome-focused leadership: Tools like Hubstaff provide actionable insight, so managers can focus on productivity, not policing.
- Align individual efforts to business goals: Measuring performance connects day-to-day work with larger company objectives, driving meaningful progress.
Team performance measurement empowers leaders to make informed decisions, support employees effectively, and drive results that align with business goals. With the correct data and tools, performance management becomes a tool for growth, not a means of control.
Core team performance metrics to track
Before you start tracking team performance, it’s crucial to understand which metrics actually matter.
Measuring hours worked is one thing—but what really moves the needle is how that time translates into meaningful output.
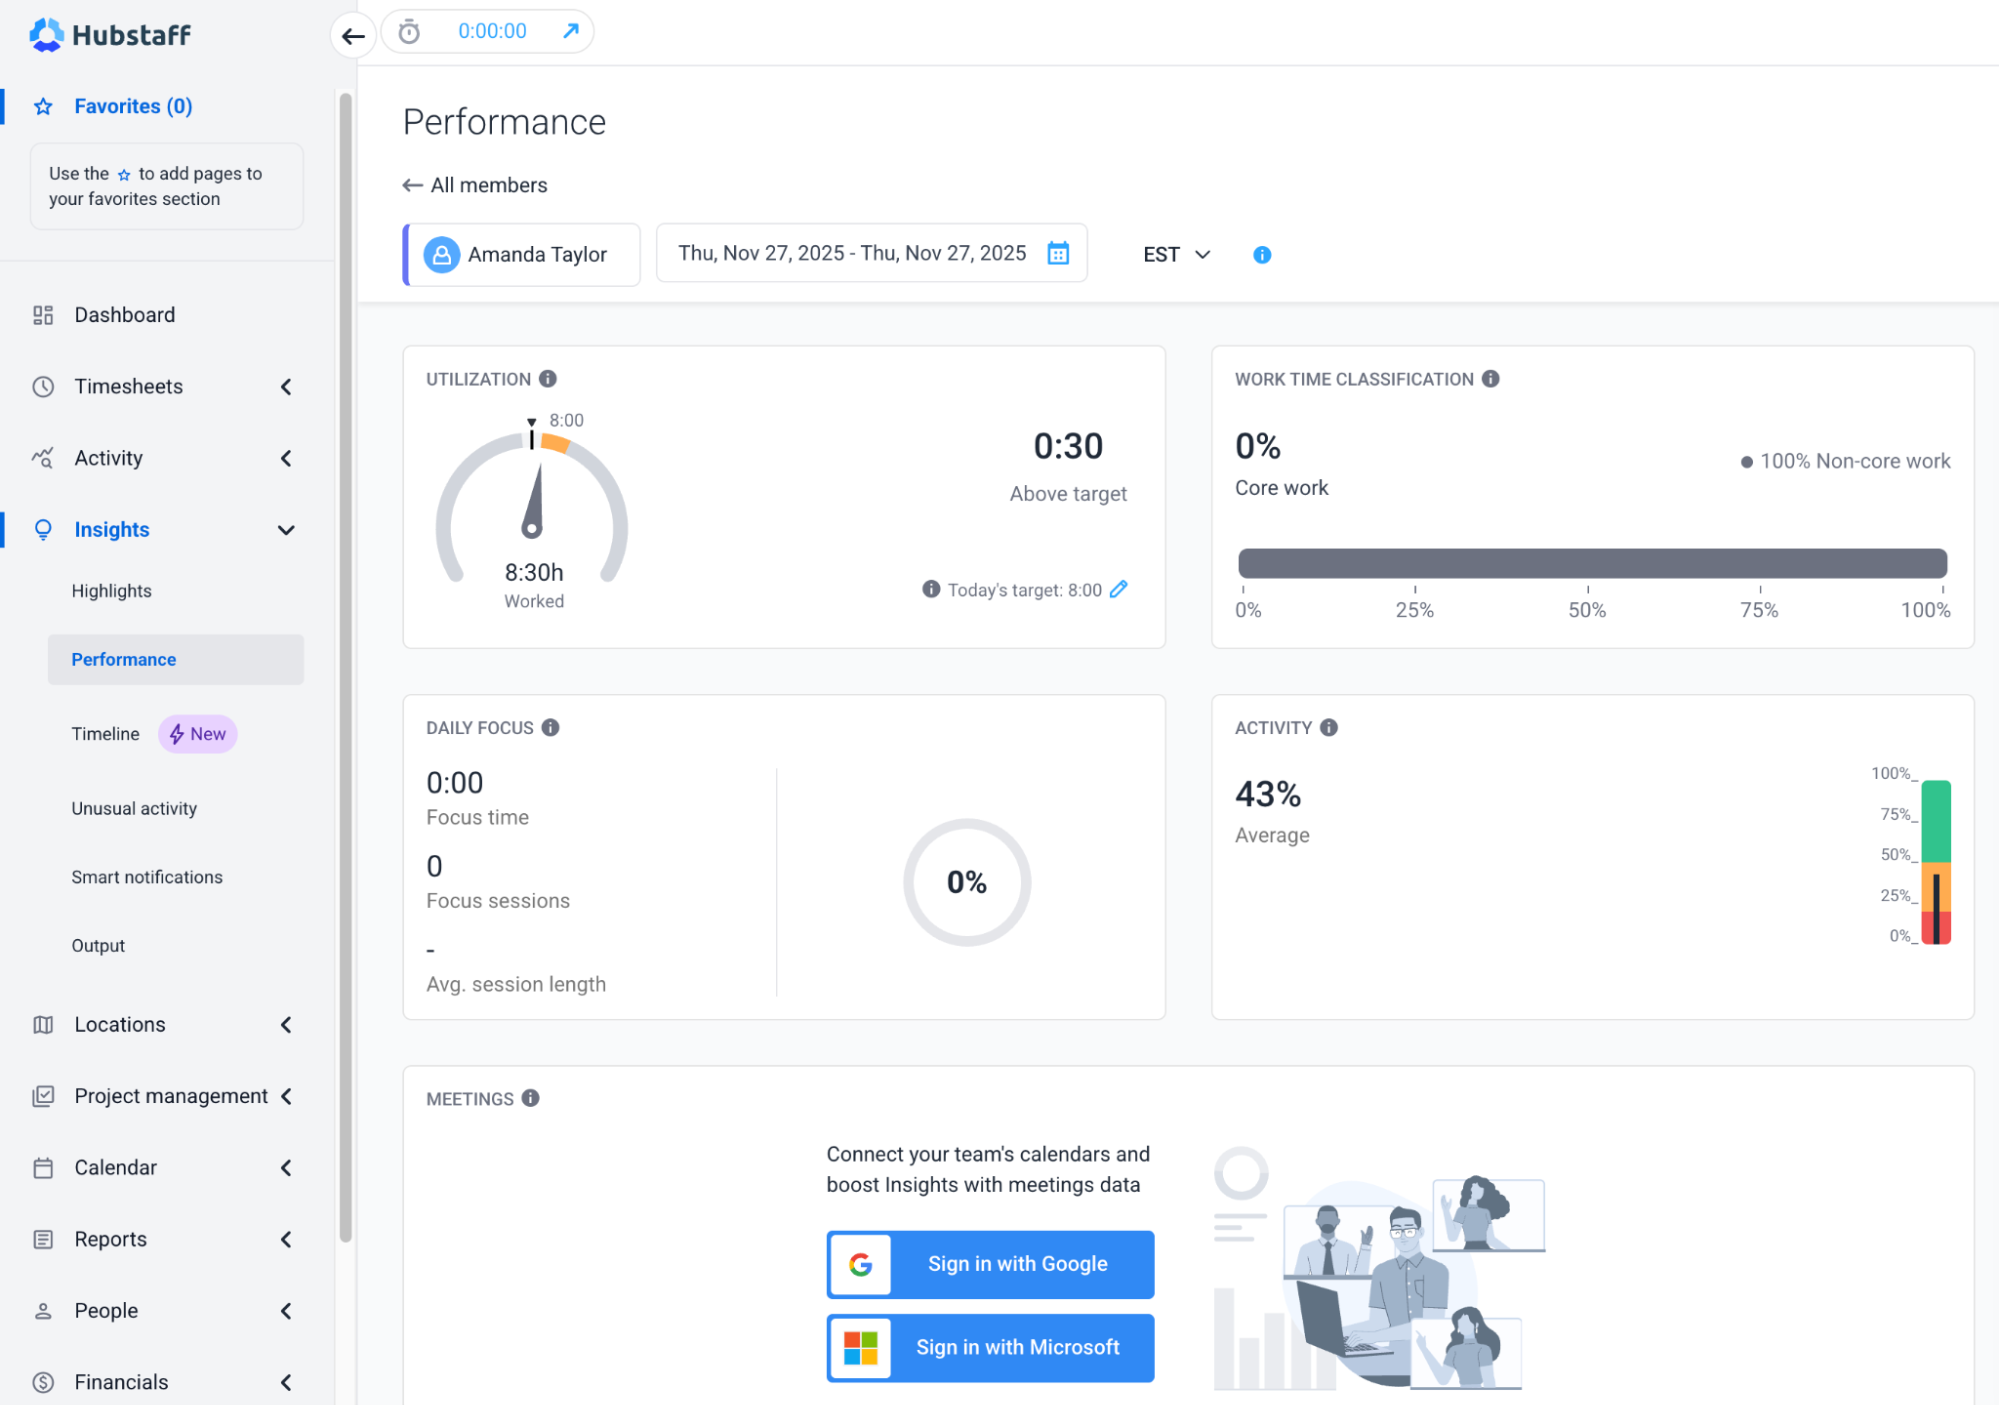
Hubstaff focus time data reveals that average focus time accounts for just 53% of the workday across all workstyles — a surprisingly consistent figure.
- Remote teams: 52%
- Hybrid teams: 57%
- In-office teams: 46%
It is essential to understand how teams allocate their time, not just track it. Leaders can access real-time visibility into team performance and trends with workforce analytics tools.
Let’s look at the core team performance metrics worth tracking, along with examples of how to apply them.
1. Productivity and output metrics
When it comes to productivity and output, one question quickly comes to mind for managers. How much is the team producing, and at what pace?
As a manager, look for these metrics to identify high-performers and inefficiencies:
- Hours tracked vs. project output: Measure whether the time spent is yielding proportionate results.
- For instance, if a developer logs 40 hours but only delivers one small feature while another delivers three, you may have a workload issue or a productivity gap.
- Utilization rates: Calculate the percentage of available hours that are used productively.
- Example: A team member is available for 40 hours/week but spends only 20 on focused, billable tasks. Their utilization rate is 50%, which may suggest underassignment or distractions.
- Task or milestone completion: Track how consistently and quickly team members meet project milestones.
- Example: A designer consistently misses UI milestone deadlines by 2–3 days. This pattern, over time, can reveal a trend helping with workload adjustments or clearer briefs.
2. Workflow and efficiency metrics
Is your team workflow flowing smoothly or getting stuck? Workflow and efficiency metrics help surface where work slows down across tasks, handoffs, and dependencies.
- Task cycle times: Measures how long it takes to complete a task from start to finish.
- Example: A typical support ticket takes 6 hours to resolve. A spike to 14 hours indicates bottlenecks in support processes.
- Time between handoffs: The time lag between when one team member finishes a task and the next person picks it up matters.
- For example, a content writer finishes a draft on Monday morning, but the editor doesn’t start until Wednesday, delaying the entire pipeline.
- Idle vs. active time ratio: The idle vs. active time ratio helps calculate activity level, measuring the time actively spent on tasks versus the time when little or no input is detected.
- A low active ratio could signal distractions, unclear task ownership, or waiting on dependencies.

How Activity Levels Are Calculated in Hubstaff
3. Quality and reliability metrics
Are we delivering consistent, high-quality work?
- Error or revision rates: Measures how often work needs to be redone or corrected.
- Example: A developer’s pull requests consistently require extensive changes, signaling a need for mentoring or process tweaks.
- On-time completion percentage: Tracks the percentage of tasks finished by the expected due date.
- Example: If your QA team completes only 60% of tasks on time, consider reallocating resources or adjusting deadlines.
4. Engagement and attendance metrics
Engagement and attendance metrics are indispensable. These signals should be interpreted over time and in context, not as a judgment of individual effort on a single day. Evaluate attendance reliability over time, especially in remote and hybrid teams.
- Focus time vs. distractions: Shows how much time is spent actively working vs. inactive, distracted, or switching tasks too frequently. For instance, an engineer has high login hours but low focus time, indicating they’re logged in, but not working intensely.
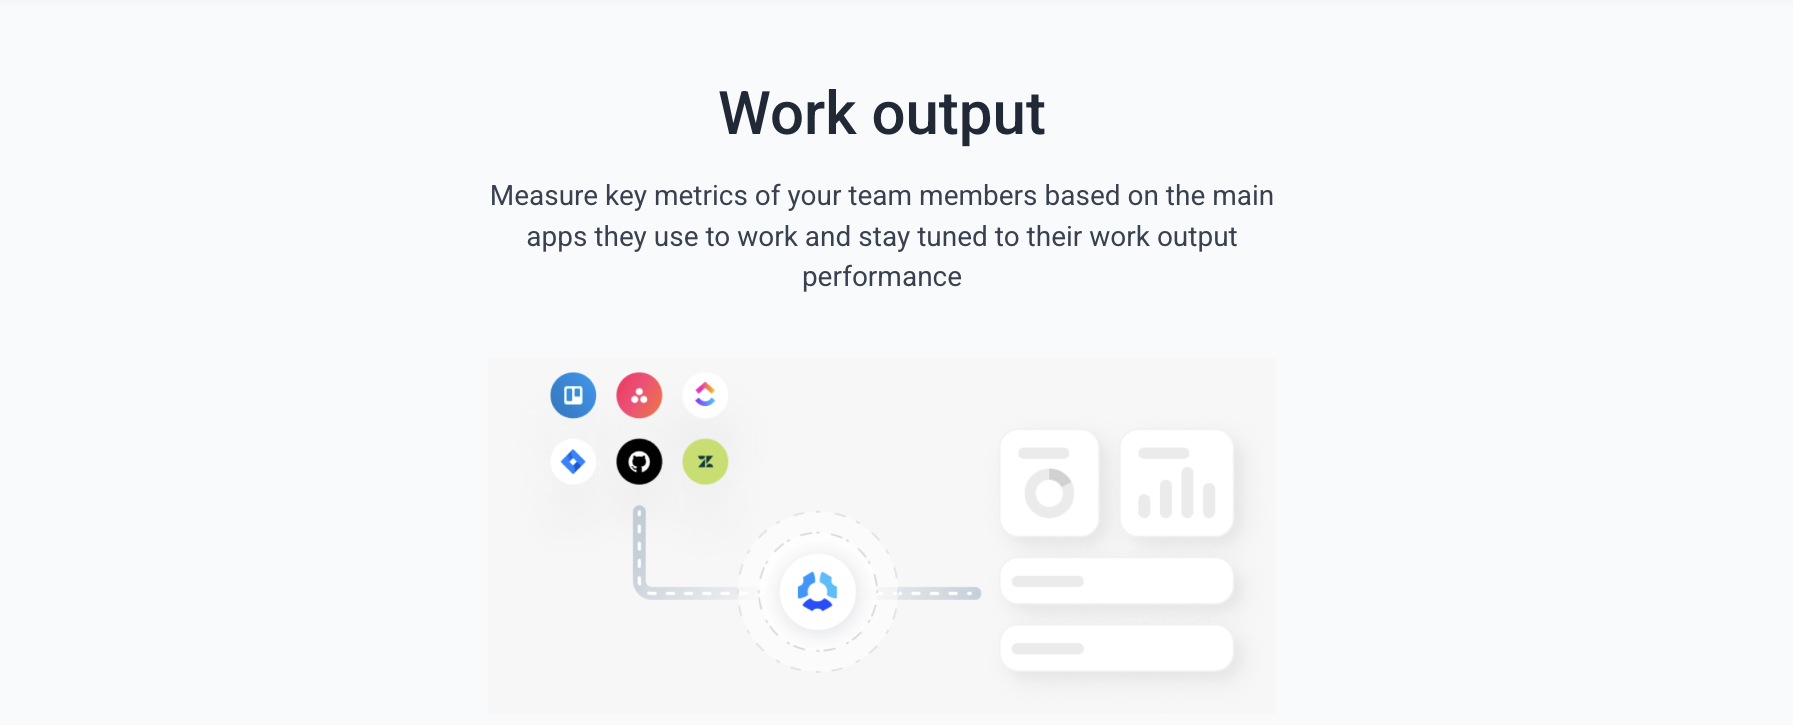
Workforce analytics help surface performance trends across different roles by categorizing how work time is spent. It breaks down work time into three main categories:
- Core tasks (key deliverables)
- Non-core tasks (emails, admin, support)
- Unproductive time (unproductive apps, distractions, context switching)
5. Profitability and cost efficiency metrics
Are we getting a strong return on time and talent? Profits are directly related to cost efficiency.
- Billable vs. non-billable time: Measures how much of your team’s time is spent on revenue-generating tasks. Example: A marketing consultant with only 30% billable hours might be overburdened with internal meetings or admin work.
- Cost per deliverable: Calculates the labor cost behind producing each unit of work.
- Example: If a social media campaign takes 50 hours at an average hourly rate of $50, the cost per campaign is $2,500. Compare this across campaigns to assess efficiency.
Optimizing your team’s performance isn’t about watching the clock. It’s about seeing the full picture. The best way to maximize your team’s performance is to utilize your management dashboard and identify areas for improvement.
How to measure team performance using data
Measuring team performance effectively begins with data—but not just any data. To truly assess and improve your team’s output, you need a strategic mix of goal-setting, consistent tracking, and contextual analysis.
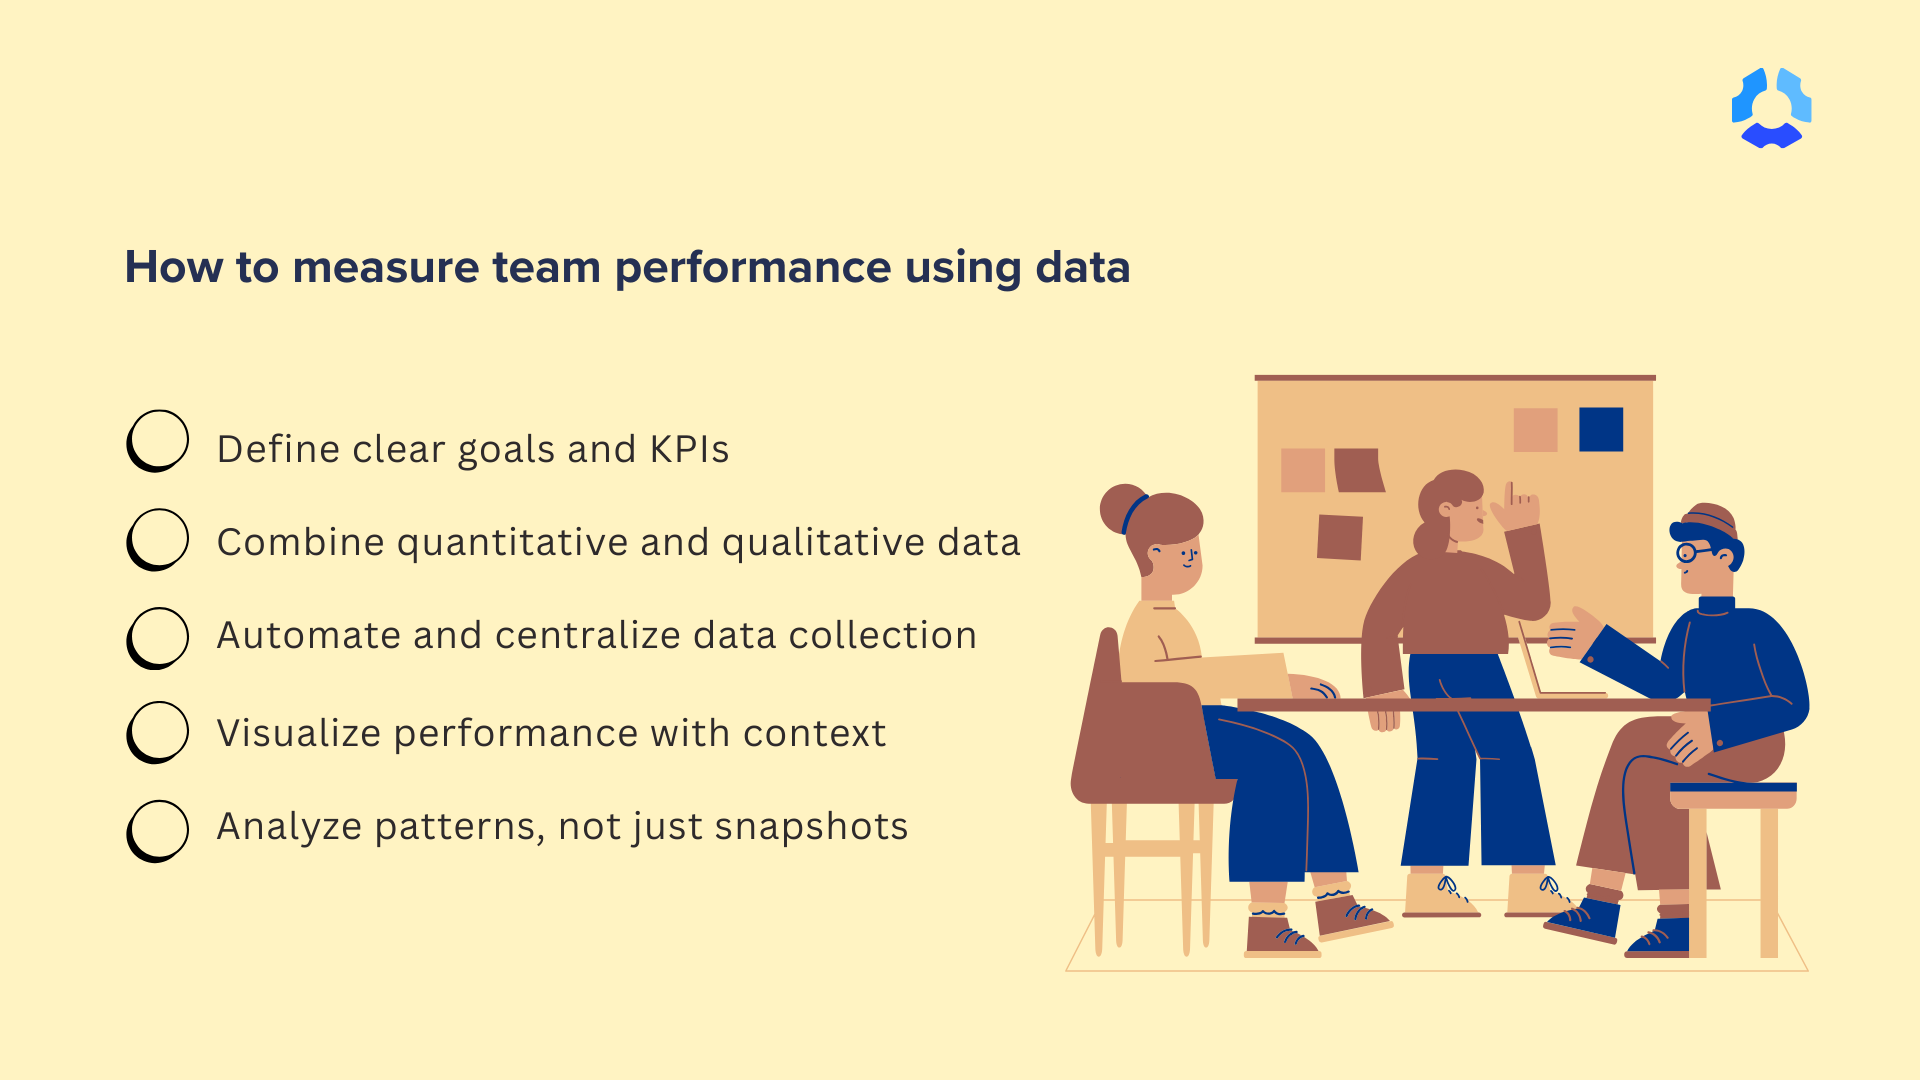
1. Define clear goals and KPIs
Utilize employee goal-setting techniques, such as the SMART goals (Specific, Measurable, Achievable, Relevant, Time-bound), to align team efforts with business objectives and establish a shared understanding of performance.
Key KPIs might include:
- Cycle time (time to complete a task or project)
- On-time completion rates
- Task throughput or velocity
2. Combine quantitative and qualitative data
Numbers tell part of the story, and context tells the rest. Use both to get a complete view of team performance.
Quantitative metrics:
- Time spent per task
- Completion rates
- Productivity trends over time
Qualitative metrics:
- Stakeholder or client feedback
- Team member self-assessments
- 360° performance reviews
3. Automate and centralize data collection
Manual tracking wastes time and introduces errors. Use performance management or time-tracking tools to collect automatically:
- Task-level time logs
- App and web usage data
- Project progress updates
- Team activity levels
Automation reduces admin work and provides real-time visibility into team performance.
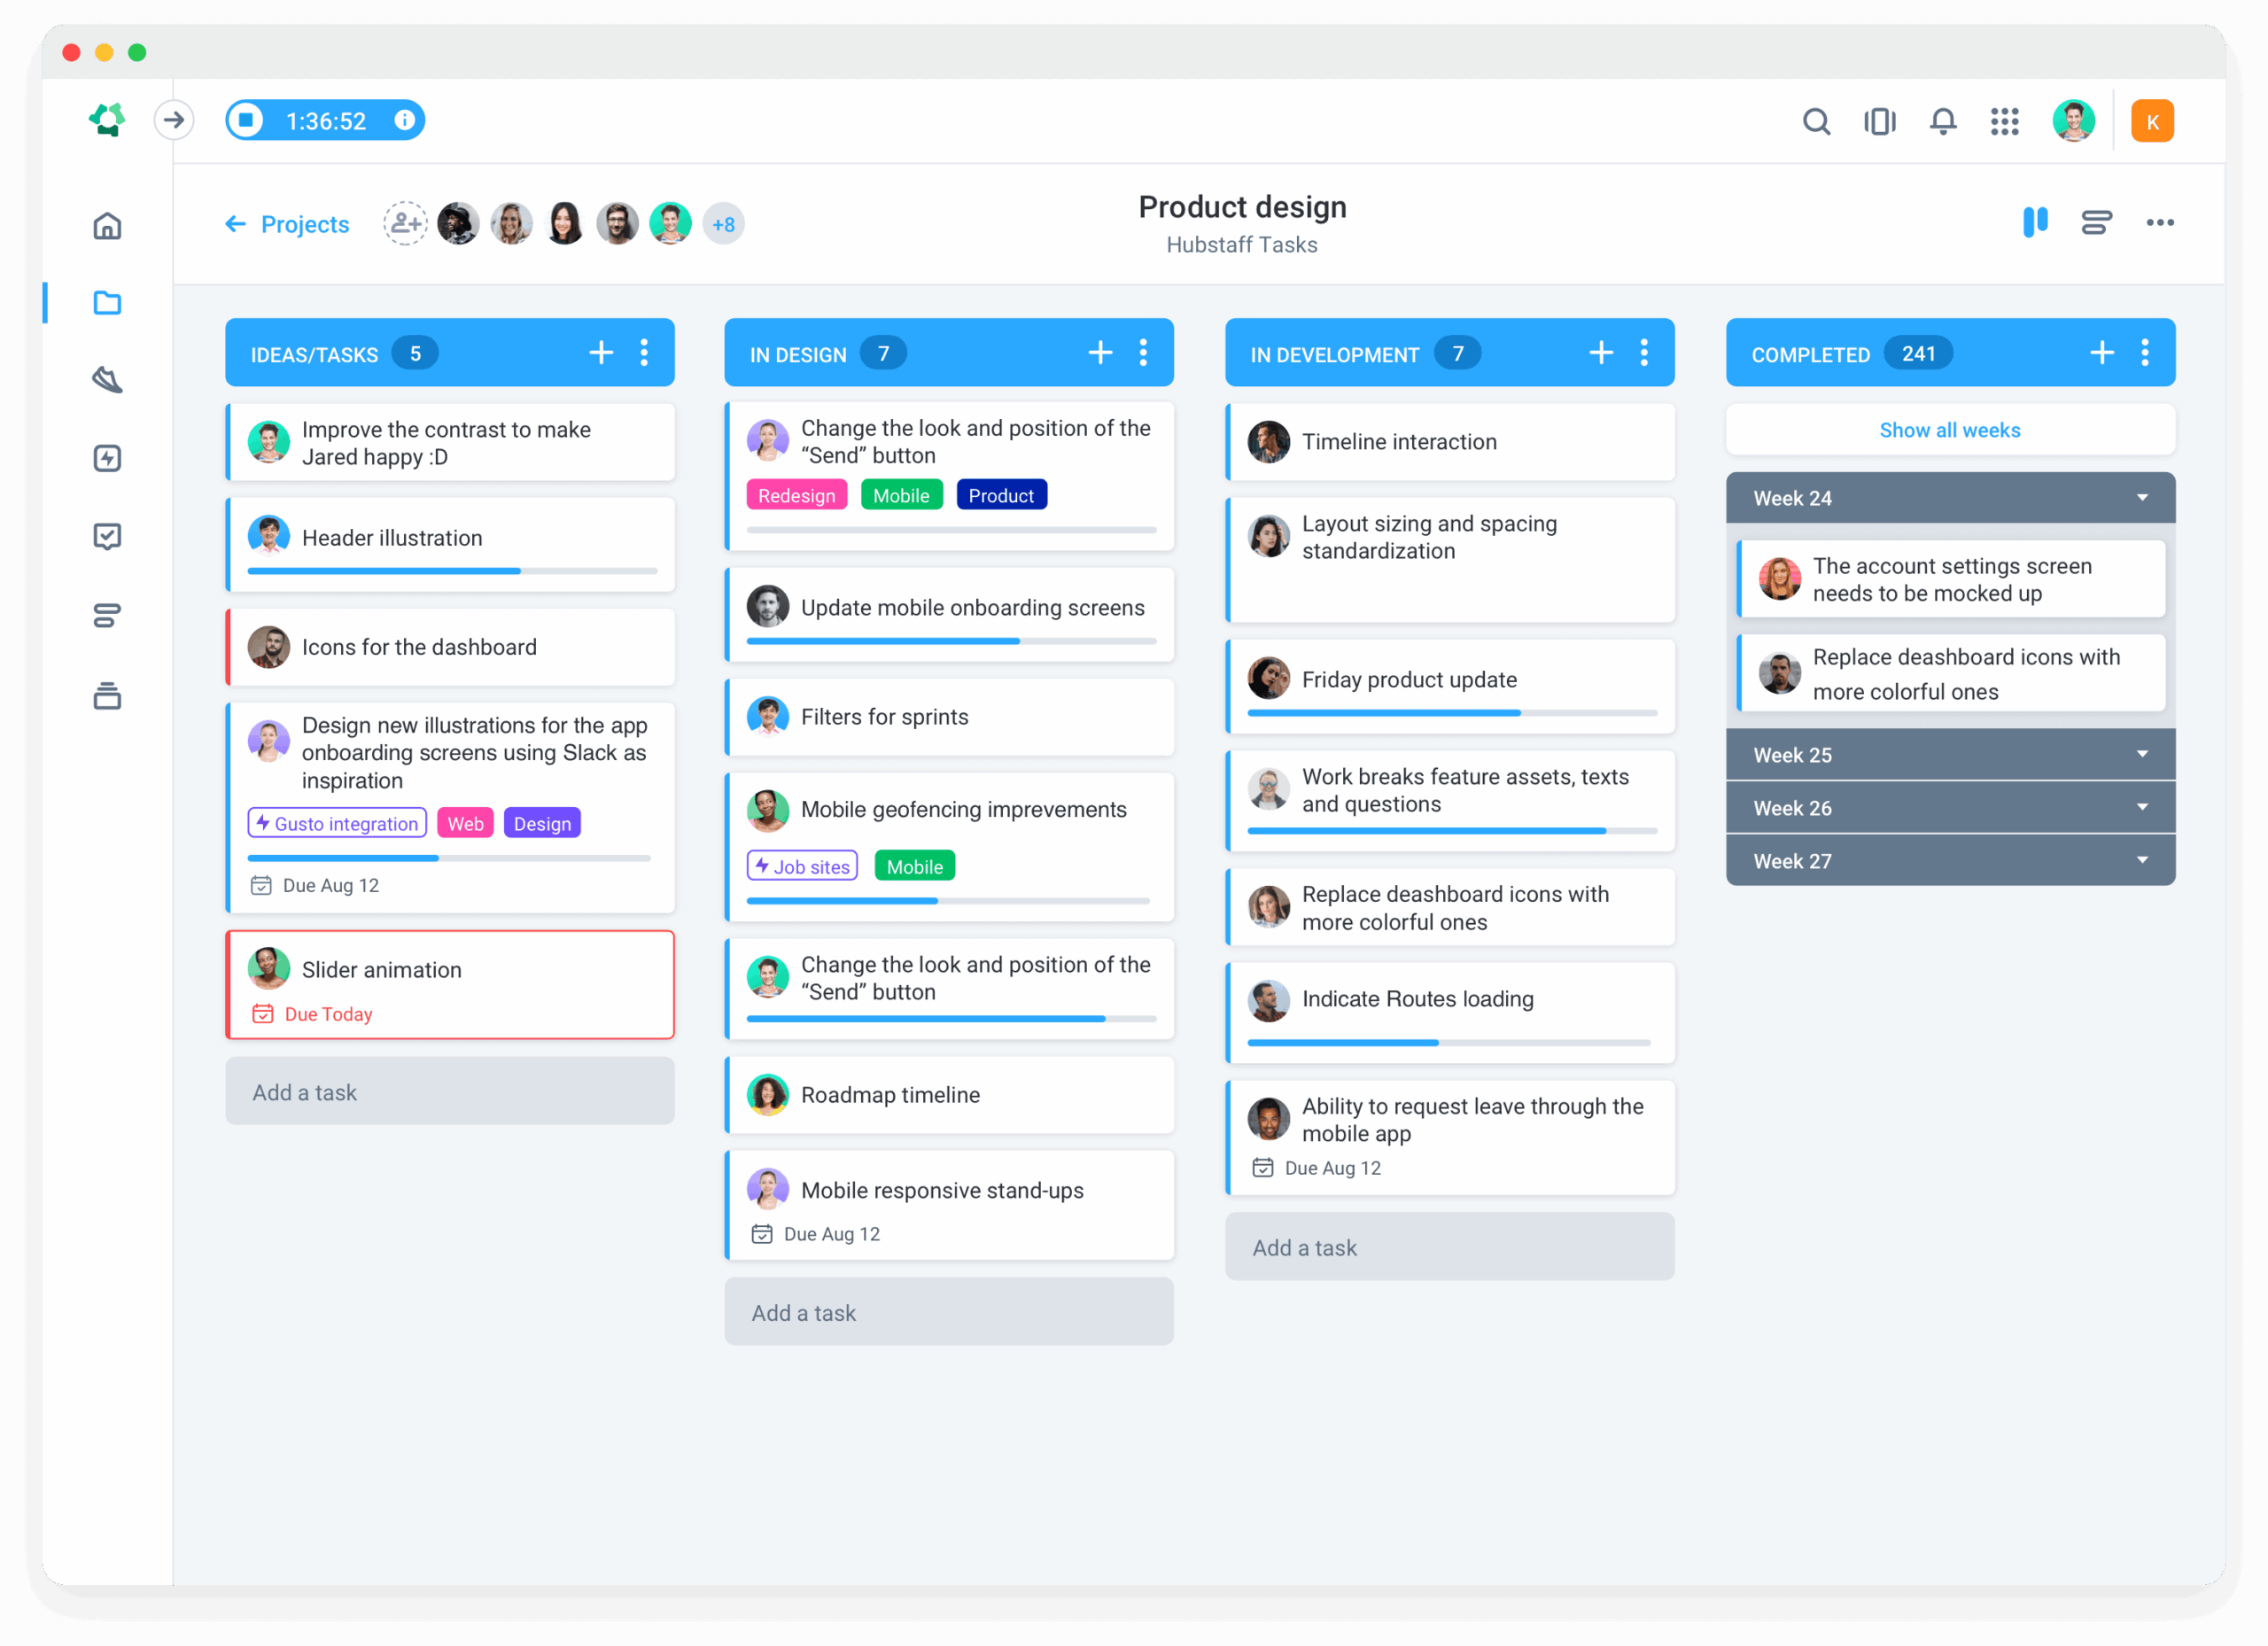
4. Visualize performance with context
Utilize dashboards and reports to present key metrics in a clear and concise format. Visualization tools can highlight:
- Team trends over time
- Comparison across teams or departments
- Project-specific progress or delays
Pro tip: Always pair metrics with context. A dip in productivity might reflect external factors, such as shifting priorities, rather than team inefficiency.
5. Use visual tools to highlight
- Productivity trends over time
- Comparisons across teams or projects
- Delays or risks in project timelines
Pro tip: Always pair data with context. A drop in output could reflect shifting priorities—not poor performance.
6. Analyze patterns, not just snapshots
Don’t make decisions based on isolated metrics. Look for patterns over time:
- Is one team consistently outperforming?
- Did a process change improve delivery speed?
- Are some workloads imbalanced?
Pro tip: Metrics without context can be misleading and damage trust. Analyze with a big-picture mindset.
7. Act on insights
Turn data into action to fuel continuous improvement.
- Fix inefficient processes
- Balance workloads
- Set better project timelines
- Offer targeted coaching
This builds a culture of growth, not micromanagement—where teams feel empowered, not scrutinized.
Using metrics to drive continuous improvement
Tracking team performance is just the starting point, but the real value comes from what you do with the data. Metrics don’t improve team performance by themselves; they inform the conversations and decisions that do.
Regular check-ins rooted in objective data help teams quickly identify:
- What’s working
- Where they’re stuck
- How to adapt.
For example, a weekly review of team reports might reveal that certain team members are overloaded while others have available capacity. Or you might notice a drop in focus time, prompting a discussion about distractions or unclear priorities.
We’ve come a long way from traditional HR-style performance management. The modern distributed work environment is all about building a culture of iteration.
However, the core question becomes: “What can we improve based on what the numbers are telling us?”
When teams use data to self-adjust, they become more resilient, efficient, and aligned.
Tools that help you track and analyze team performance
While basic tools like spreadsheets or manual time logs can capture some data, they’re slow, inconsistent, and prone to error. They don’t scale, and they certainly don’t provide real-time insights.
Modern teams need performance tools that go beyond surface-level tracking.
Hubstaff is a time tracking platform with built-in productivity measurement to support visibility and continuous improvement.
With Hubstaff, you get:
- Real-time visibility: See where time is going, what tasks are being worked on, and how focused your team is.
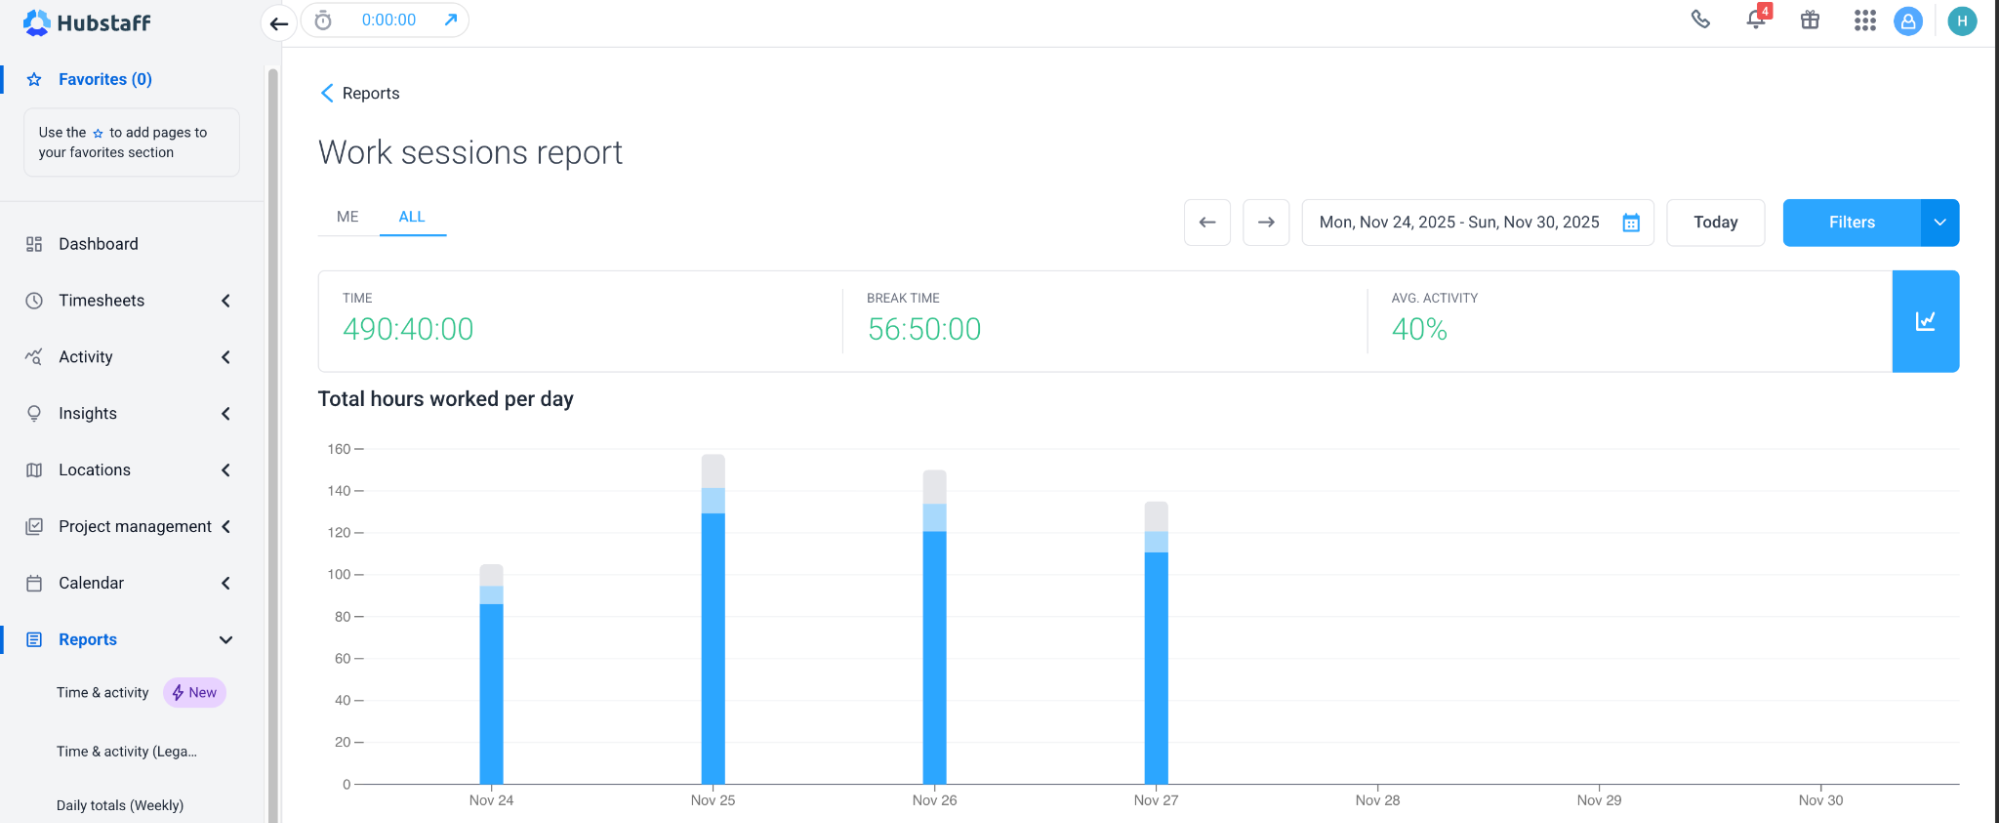
- Automated reports and insights: Identify patterns in productivity, project progress, and workloads with 20+ automated reports, no need for manual tracking.
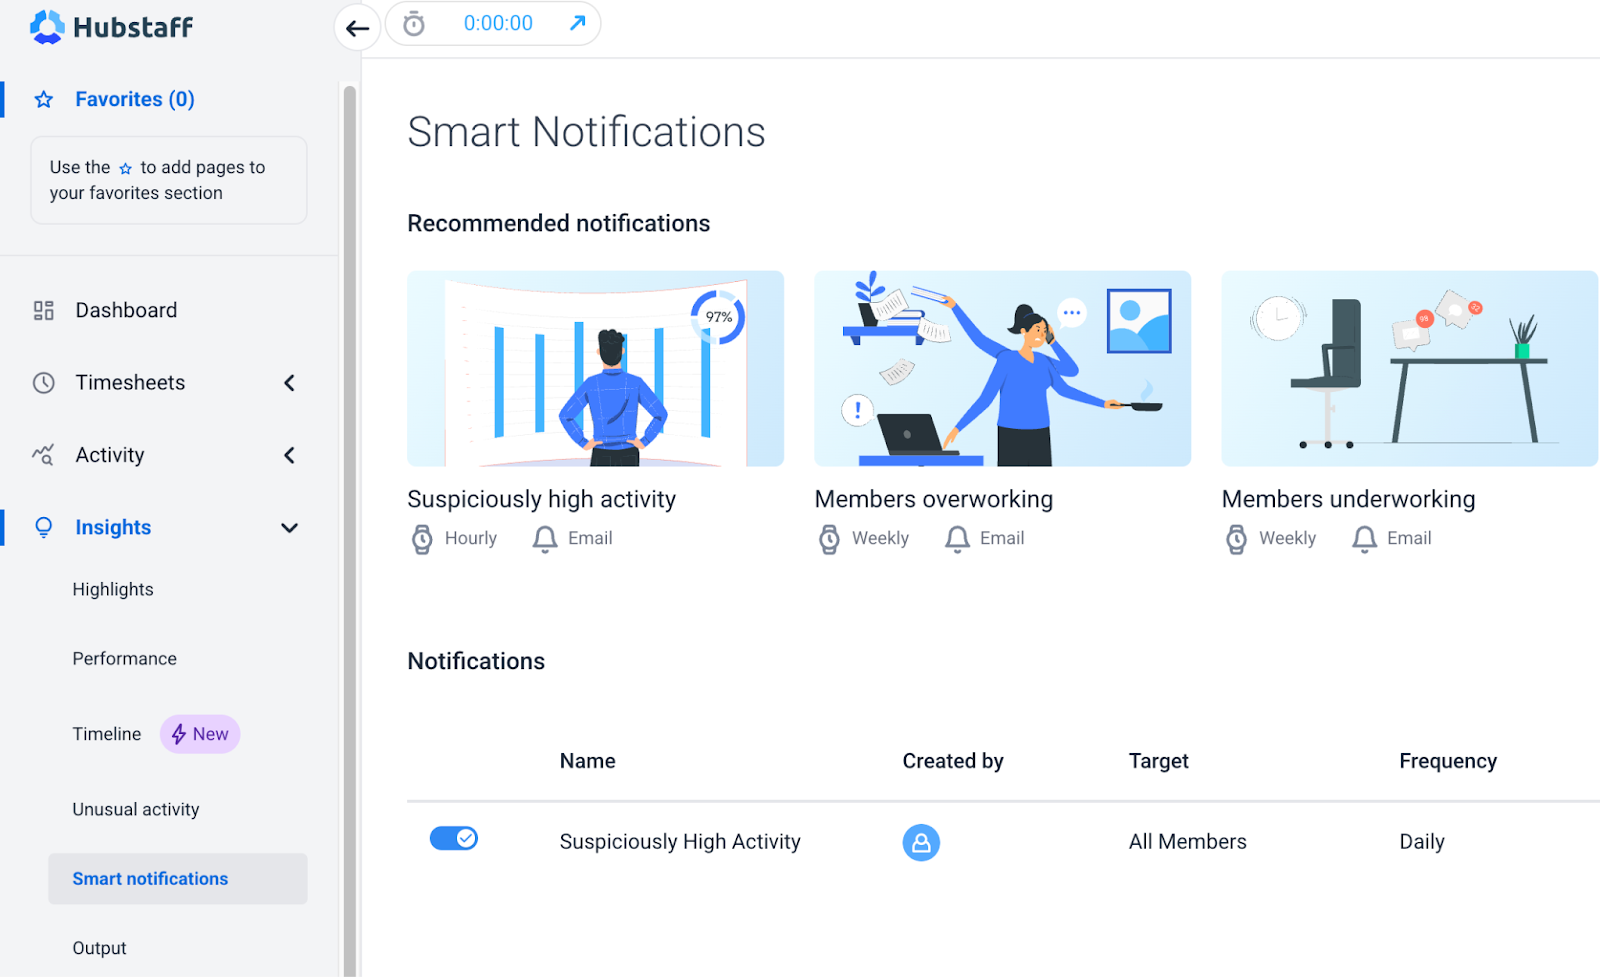
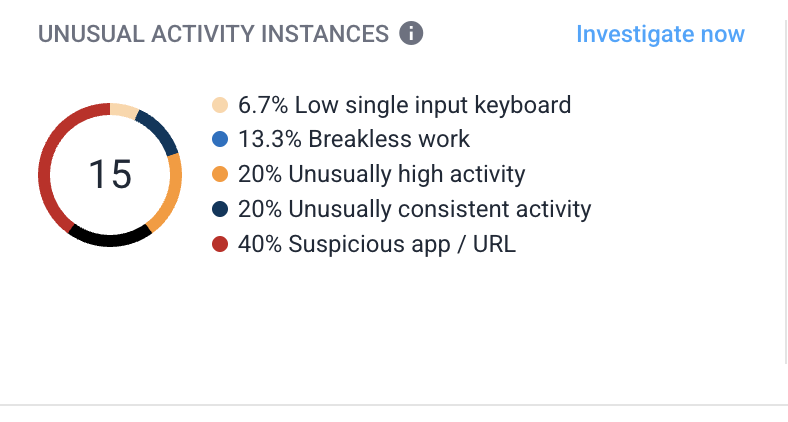
- Smart notifications: Get alerted to anomalies like unusual activities or sudden spikes in workload with AI-powered unusual activity tracking.
- Team-level AI-powered workforce analytics: Analyze productivity patterns over time, compare performance across teams or roles, and make decisions based on trends rather than one-off snapshots.
With shared visibility into time, output, and performance trends, teams can move from reactive fixes to proactive improvement.
Conclusion: Measure first to improve fast
The fastest path to better performance starts with visibility and accountability. When teams can clearly see what’s working and what isn’t, they’re empowered to make improvements that actually make a difference.
With a shared view of time, output, and performance trends, Hubstaff helps teams and leaders identify what matters most and act on it.
Whether it’s optimizing workloads, reducing distractions, or consistently meeting deadlines, the process begins with measurement.
See the data. Spot the trends. Make meaningful changes fast.

Most popular
7 Tools That Help Monitor AI Usage at Work in 2026
AI is everywhere. Adoption continues to grow, but from monitoring AI usage, we’ve learned that daily use is still a mixed bag, a...
Hidden AI Usage in the Workplace: What Your Tools Don’t Tell You
How much has AI changed your team’s work? On the surface, work might not look that different. The meetings are still there, docu...
How Many Meetings Are Too Many? 2026 Benchmarks by Role
How many meetings are too many? In 2026, the honest and boring answer is: it depends on your role. Our 2026 Global Trends and Benc...
When Evening Work Becomes a Red Flag: How to Fix Triple-Peak Overload with Smarter Core Hours (2026 Data)
Most people don’t remember the first time they worked in the evening, and even fewer people know when the last evening work sess...