Top Workforce Management Metrics and KPIs
- Tracking workforce metrics like TCOW, attrition, and absenteeism gives businesses a full financial picture — replacing a $60K employee alone can cost up to $45K, per SHRM.
- Benchmarking absenteeism against the BLS national average of 2.8% helps identify cultural or policy gaps before they escalate into larger retention and productivity problems.
- Combining output-based KPIs like project completion rate with experience metrics like engagement scores gives managers a complete view of workforce health and performance.

Workforce management metrics are now a crucial part of managing your workforce.
Monitoring workforce management metrics can lower operational costs and ensure positive results in your team’s happiness and your product and sales output. As businesses grapple with international lockdowns, asynchronous work, and hybrid schedules, they must utilize workforce management metrics to maintain productivity.
There are many ways to measure — but which ones are the most important? In this article, we’re looking at the top workforce management metrics and KPIs you should be focusing on for your business.
Boost your team’s efficiency with Hubstaff's productivity tools
Top workforce management metrics and KPIs
Metrics are measurements of overall business health, while KPIs (Key Performance Indicators) measure progress toward specific goals. Often, a company will have a core set of metrics they need to focus on at a high level but then set individual KPIs for particular departments and individuals.
Here are seven of the critical workforce management metrics you can monitor and create KPIs from:
1. Total Cost of Workforce (TCOW)
The first workforce management metric is the Total Cost of Workforce (TCOW), and that’s more than just employee salaries. It’s the total amount invested in human capital.
Components of TCOW:
- Direct compensation: Salaries, wages, and bonuses.
- Health benefits: Medical, dental, and vision insurance.
- Taxes: Payroll taxes, social security, and unemployment insurance.
- Workforce overhead: Equipment, facilities, travel, and relocation expenses.
For example, If a company spends $3 million annually on salaries, $500,000 on health benefits, and $200,000 on taxes and other overheads, the TCOW would be $3.7 million.
2. Employee productivity
Tracking employee productivity in workforce management is entirely dependent on the nature of your business and what matters to stakeholders. For example, call centers usually have staffing productivity KPIs that center around the number of calls they should take each hour or how long each should last. However, these KPIs need to be weighed against customer satisfaction metrics. Otherwise, your call staff could just put customers on hold and then hang up on them to hit their KPIs.
For example, A call center sets a KPI for agents to handle 30 calls per hour with a customer satisfaction score above 90%. Monitoring these metrics helps balance efficiency and quality.
Tool: Hubstaff offers a suite of employee productivity tracking tools that managers will love.
3. Attrition rates (voluntary vs. involuntary employee turnover)
Voluntary vs. involuntary employee turnover is a vital staffing metric to track. High employee turnover rates impact company culture, brand perception, productivity, and overhead. Retention is key.
The Society for Human Resource Management (SHRM) reported that it costs a company six to nine months of an employee’s salary to replace them.
For example: An employee making $60,000 per year, it costs $30,000 – $45,000 to recruit and train a replacement. If a company with 200 employees experiences 20 resignations and 10 terminations in a year, the voluntary turnover rate is 10% and the involuntary turnover rate is 5%.

4. Recruitment
In the same way that voluntary vs. involuntary employee turnover is a critical workforce management metric, so is recruitment. Top metrics for measuring recruitment, onboarding, and staffing include source of hire, acceptance rate, applicants per hire, and hiring manager satisfaction.
Formula: Time it takes to fill each position over a time frame/number of roles filled
For example, If it takes 45 days to fill 10 positions, the Time to Fill is 4.5 days.
5. Customer satisfaction
Collecting feedback from clients about their experience with your employees provides insights into your team’s performance. Use standardized questions with a 1-10 score rating to get measurable data, focusing on the employee’s performance rather than the product or company.
For example: After a customer service interaction, a survey might ask, “How satisfied are you with the service you received?” with responses ranging from 1 (very dissatisfied) to 10 (very satisfied).
6. Employee satisfaction
When calculating workforce metrics, businesses must factor in employee satisfaction. Typically, the factors that are a part of employee satisfaction include remuneration, rating of leadership, stress and mental health levels, teamwork, company culture, employee engagement and work-life balance.
Today, companies need to be tuned in to the well-being of their employees. Not only because it’s the right thing to do but because it is directly linked with employee engagement, productivity, retention, and profitability.
According to the American Institute of Stress, 83% of US employees suffer from work-related stress, with 25% saying their job is the number one stressor in their lives.
For example, Conducting an annual employee satisfaction survey with questions about various aspects of their job and workplace environment can provide actionable insights.
7. Average absenteeism percentage
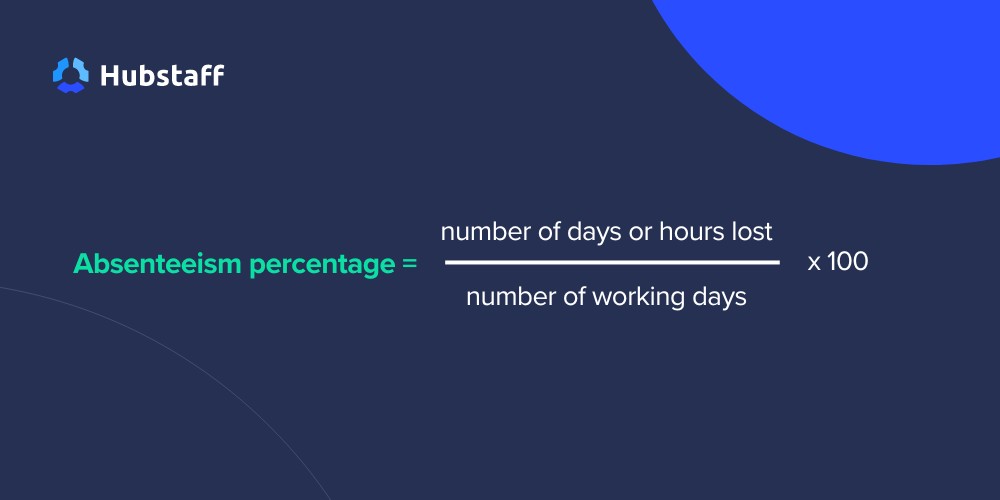
Following on from employee satisfaction is the average absenteeism percentage. This is a core workforce management metric because it focuses on the total number of days or hours lost to sickness, injury, stress, or unauthorized absences.
According to the Bureau of Labor Statistics (BLS), the absence rate for all full-time wage and salary workers is 2.8%. If your staffing absenteeism percentage is above average, ask questions about your policies or company culture.
You can also look at how to remedy this with solutions like private health coverage, mental health counseling, and improved work conditions.
Formula: (number of days or hours lost/number of working days) x 100
For example, If a company with 250 working days a year has employees who collectively miss 700 days, the absenteeism rate is (700/250 x number of employees) x 100
Workforce productivity metrics
Tracking workforce management metrics like productivity is important as it can filter down to your KPIs.
Measuring productivity identifies employee engagement areas for improvement, prioritizes them, and can also benchmark you against your competitors. Large organizations value their workforce productivity metrics and will include the following core areas to watch:
1. Projects completed
The metrics and target will vary based on the nature of your business. For instance, it is crucial in manufacturing and factory settings where the same “job” is performed repeatedly with only slight variation.
For example, A manufacturing plant tracks the number of units produced per day to monitor efficiency.
Worth watching: American Factory, an award-winning documentary by Netflix, examines the workings of an American automaker that closed and was then taken over by a Chinese billionaire. The “projects completed” theme is apparent as American workers struggle to keep up with their Chinese counterparts.
2. Sales

When it comes to sales, you don’t need an introduction or explanation of why they matter in productivity metrics. They are one of the most basic measures of your company’s health.
Sub-metrics: There are various sub-metrics here, such as sales growth. This metric benchmarks you against yourself over time. How are your sales compared to last year or five years ago? What are your projected sales for next year or five years?
Formula: Price of each product or service x Number of units or services sold
For example, if sales were $1 million last year and $1.2 million this year, the sales growth would be 20%.
3. Revenue per employee

The revenue per employee metric essentially snapshots the money you receive due to having each employee in place.
This metric isn’t used to uncover that Amy (who works in admin) isn’t bringing you direct revenue. Not every employee will be in a sales or customer-facing role.
Also, it shows you how effectively and profitably your business is running. It can also benchmark against competitors’ profitability and staffing norms in other industries.
Formula: Total revenue for the last 12 months (LTM)/Current number of full-time employees
For example, If a company generates $10 million in revenue with 50 employees, the revenue per employee is $200,000.
Workforce planning metrics
Workforce planning metrics are essential for aligning human resources strategies with business goals. These metrics help organizations anticipate their future workforce needs, identify skills gaps, and ensure that they have the right people in the right roles at the right time. By leveraging these metrics, companies can improve operational efficiency, reduce costs, and enhance overall workforce management, employee satisfaction, and productivity.
Key benefits of workforce planning metrics
- Advanced workforce planning: Ensuring the right number of employees to meet business demands without overstaffing or understaffing.
- Enhanced employee development: Identifying skills gaps and providing targeted training and development programs.
- Improved budget management: Accurately forecasting labor costs and aligning them with business objectives whilst maintaining healthy cash flow.
- Increased agility: Adapting quickly to market changes and business needs with a flexible workforce planning strategy.
- Strategic talent acquisition: Hiring the right talent based on data-driven insights into future needs.
Example: Using historical data and business growth projections to forecast the need for additional sales representatives over the next year.
Resources:
How to identify and track KPIs in workforce management
- Identify your primary business goals, such as increasing revenue, improving customer satisfaction, enhancing productivity, or reducing costs. Ensure each KPI measures progress toward a specific goal.
- Choose KPIs that provide meaningful insights and avoid vanity metrics. Ensure the KPIs lead to actionable outcomes and guide decision-making.
- Set SMART targets that are Specific, Measurable, Achievable, Relevant, and Time-bound. This ensures clear, realistic objectives aligned with your business goals.
- Gather and analyze data using tools like CRM systems, HR software, project management tools, and financial tracking systems to collect data. Regularly analyze this data to identify trends and areas for improvement.
- Implement and monitor Incorporate KPIs into regular operations and monitor them continuously. Periodically review and adjust strategies to stay aligned with business goals.
Workforce management metrics: A quick checklist
To effectively utilize workforce management metrics, ensure you have:
- A clear business strategy for the next five years, signed off by key stakeholders.
- Agreement on the key metrics that relate to your business goals and drive success.
- The right workforce management software or processes to monitor productivity, recruitment, retention, employee satisfaction, customer satisfaction, and other essential metrics.
- Solid data is collected from employees, the company, the labor market, and benchmark industries or competitors.
- A team of senior leaders and HR experts to translate metrics into actionable strategies and policies.
- A strong commitment to change and improvement. Without this, even the most comprehensive data and KPIs will not lead to meaningful progress.
By focusing on these elements, you can effectively leverage workforce management metrics to drive your business forward and achieve your organizational goals.
FAQs
What is the KPI in workforce management?
KPI stands for Key Performance Indicator. In workforce management, KPIs are specific metrics used to measure the performance and effectiveness of various aspects of an organization’s workforce. These indicators help managers and HR professionals track progress toward strategic goals, make informed decisions, and identify areas for improvement.
What are the key performance indicators KPIs for an organization’s workforce?
Key Performance Indicators for workforce management vary depending on the organization’s goals and industry. However, some common KPIs include:
- Employee Turnover Rate: Measures the percentage of employees who leave the organization over a specific period.
- Time to Fill: Tracks the average time taken to fill vacant positions.
- Employee Productivity: Measures the output of employees relative to their input (e.g., tasks completed per hour).
- Employee Engagement: Gauges the level of commitment and involvement employees have in their work and the organization.
- Absenteeism Rate: Monitors the percentage of scheduled workdays missed due to unplanned absences.
What are the 5 Key performance indicators for a company?
The five key performance indicators (KPIs) for a company include Revenue Growth Rate, Net Profit Margin, Customer Satisfaction Score (CSAT), Employee Turnover Rate, and Operational Efficiency. Revenue Growth Rate measures revenue increase over time, indicating company growth. Net Profit Margin shows profit as a percentage of revenue, reflecting financial health. CSAT gauges customer satisfaction with products or services. Employee Turnover Rate measures the percentage of employees leaving the company, indicating retention. Operational Efficiency assesses how effectively resources are used, with higher efficiency leading to cost savings and productivity.
What are the 4 KPIs every manager has to use?
Every manager should track specific KPIs to ensure their team’s performance aligns with organizational goals. The four essential KPIs are Employee Productivity, Customer Retention Rate, Project Completion Rate, and Sales Conversion Rate. Employee Productivity measures output relative to input, tracked by completed tasks or sales. Customer Retention Rate indicates the percentage of repeat customers, tracked by monitoring repeat purchases. Project Completion Rate measures on-time and on-budget project completion and is tracked with project management software. Sales Conversion Rate measures the percentage of leads converted to customers, tracked by monitoring sales data.
What is a workforce metric?
A workforce metric is a specific measurement used to evaluate and track the performance, efficiency, and overall health of a company’s workforce. These metrics can cover various aspects such as productivity, employee satisfaction, turnover rates, and more. By monitoring workforce metrics, businesses can make informed decisions to improve operations, enhance employee engagement, and achieve strategic goals.
How do you measure workforce effectiveness?
Workforce effectiveness can be measured through several key performance indicators (KPIs) and metrics, including:
- Employee Productivity: Measures the output of employees relative to their input, tracked by the number of tasks completed, sales made, or products produced per employee.
- Customer Retention Rate: Indicates the percentage of customers who continue to do business with the company over a specific period, tracked by monitoring repeat purchases and subscription renewals.
- Project Completion Rate: Measures the percentage of projects completed on time and within budget, tracked using project management software to monitor timelines and resource allocation.
- Sales Conversion Rate: Measures the percentage of leads converted into customers, tracked by monitoring the sales funnel and conversion data.
- Employee Satisfaction is gauged through surveys that assess various factors such as remuneration, leadership, stress levels, teamwork, and work-life balance.
What are workforce management statistics?
Workforce management statistics encompass a range of data points and metrics that provide insights into the effectiveness of managing a workforce.
These statistics can include:
- Total Cost of Workforce (TCOW): The total amount invested in human capital, including direct compensation, health benefits, taxes, and overhead.
- Attrition rates (Voluntary vs. Involuntary Turnover): The percentage of employees leaving the organization, indicating employee satisfaction and retention.
- Recruitment metrics: Including time to fill, source of hire, acceptance rate, and hiring manager satisfaction.
- Customer Satisfaction Scores (CSAT): Feedback from clients about their experience with employees.
- Average absenteeism percentage: The total number of days or hours lost to sickness, injury, stress, or unauthorized absences.
- Operational efficiency: Measures how effectively the company uses its resources to produce goods or services, often tracked through time taken to complete key processes or projects.
Most popular
How to Spot and Manage Work Overload Before Your Best People Burn Out
Work overload occurs when the demands placed on an employee or team exceed their available resources, leading to stress, burnout,...
Workplace Productivity Statistics in 2026: What the Numbers Say
For many businesses, having the ability to maximize output without compromising quality gives them a major edge over their competi...
Time Doctor vs. ActivTrak: Which Tool Is Right for Your Team?
Time Doctor and ActivTrak are two of the most powerful and popular time tracking solutions. Both have strong features, and both ca...
Work-Life Balance Statistics in 2026: A Global Perspective
Work-life balance has become a deciding factor in how people, especially Gen Z, choose or leave jobs. The data shows that work-lif...


![How to Identify, Define and Prioritize Business Goals in A Startup [Examples]](https://hubstaff.com/blog/wp-content/uploads/2019/04/Goals-and-Task@2x-780x390.jpg)