How to Make a PERT Chart and Why You Need One
- PERT charts help project managers visualize task dependencies, identify critical paths, and calculate expected timelines using optimistic, pessimistic, and most likely time estimates.
- Identifying slack time in your PERT chart lets teams prioritize critical path tasks, preventing delays that directly impact project delivery while managing lower-risk activities.
- Pairing a PERT chart with task management software like Hubstaff Tasks makes project data actionable, helping teams assign work, track progress, and adapt to changes faster.
Every project manager should know how to make a PERT chart.
By creating one at the start of your project, you can easily see how all the pieces fit together. At a glance, you can see:
- What needs to be done first?
- Which parts of your project will cause the biggest problems if they’re late?
- What are your milestones?
- How long should your whole project take?
In this article, we’ll talk about how to nail your PERT chart so your project runs smoothly and finishes on time.
Stay in the loop
Subscribe to our blog for the latest remote work insights and productivity tips.
What is a PERT chart?
A PERT chart is a diagram of a project’s timeline and milestones. It visually maps out an entire project so you can easily see milestones, timelines, and who is responsible for what. PERT stands for Program Evaluation and Review Technique.
A well-made chart breaks a complex project into a clear roadmap. This makes it easier to assign tasks and track them effectively, especially while managing multiple teams.
Use it to reap all of these benefits:
- Estimate timelines more accurately.
- Identify critical tasks and easily see where you have room for adjustment.
- Stay on-time and on-budget by allocating the right resources at the right times.
- Easily update timelines when you need to make adjustments mid-project.
How to read a PERT chart
At their core, PERT charts are all about estimating, tracking and managing time. Your tasks and time estimates are represented in very specific ways so that you can read a lot of information at a glance.
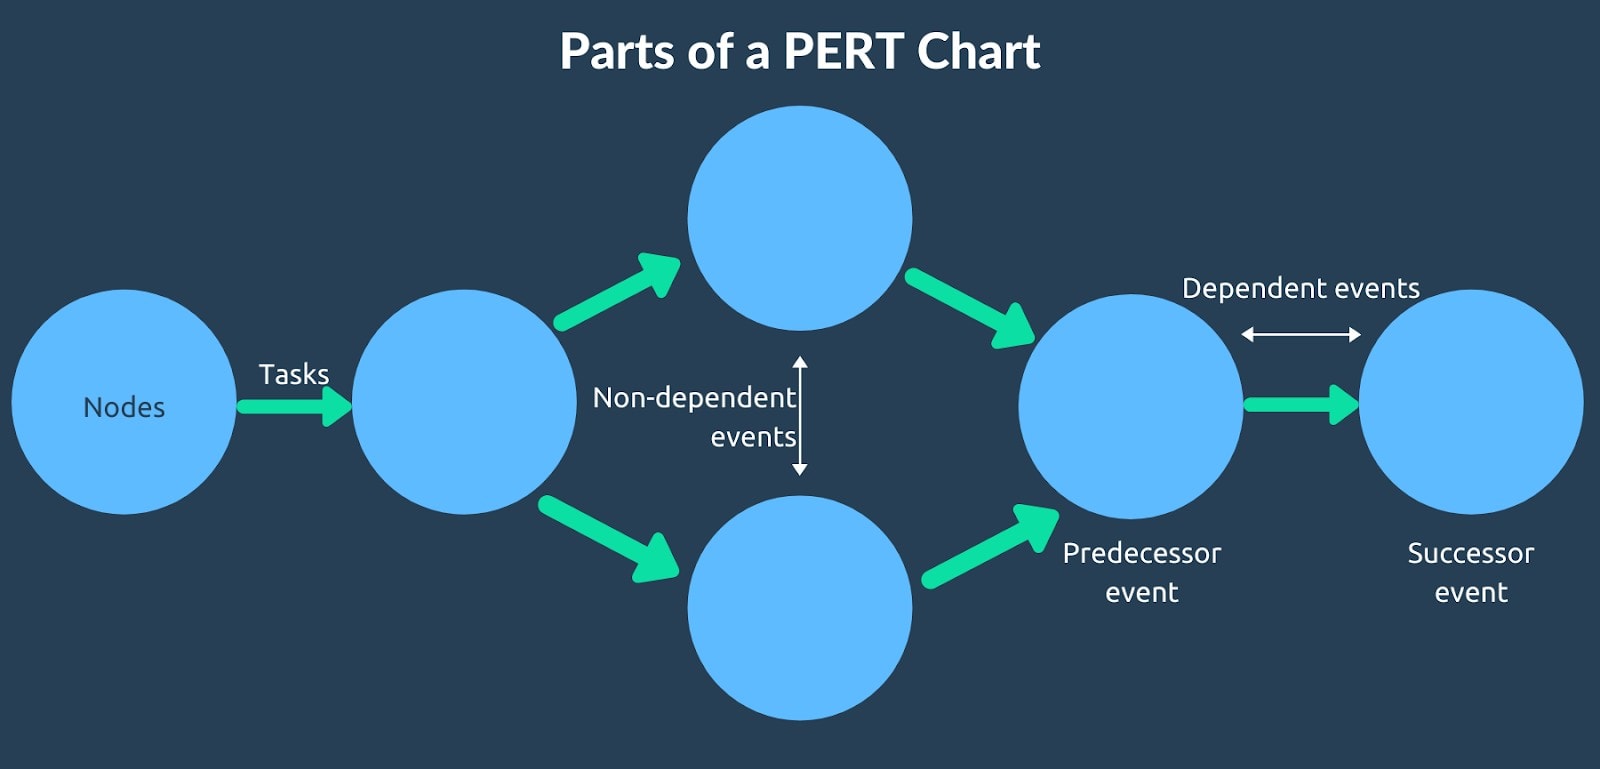
Dependent events have to be completed in order. Non-dependent events can be worked on at the same time.
A complete chart also includes time estimates for each task using expected time (te). We’ll talk about how to calculate your expected time later in this article.
Manage your team's tasks with ease
Visual workflows in Hubstaff Tasks make it simple to see where you stand.

How to make a PERT chart step-by-step
Making a PERT chart is easier to do than to describe. Let’s look at a practical example.
Say hello to Deenah.

She’s a marketing manager at a small (and fictional) furniture company. They’re getting ready to launch a brand new line of couches. Their business is direct-to-consumer, so everything they do is online.
A huge shipment of new inventory just arrived, and it’s Deenah’s responsibility to get everything onto their website fast. She owns the project management schedule, and since this project needs to be done as quickly as possible, she decides to use a PERT chart to plan and manage Project Couch.
1. Define milestones
Start by choosing milestones that represent major events in your timeline. Break each milestone down into the individual tasks needed to accomplish it. These will go in your nodes.
In our example, Deenah works with her team to figure out the major milestones for Project Couch:
- Beginning
- Website requirements complete
- Product photography uploaded to website
- Website product pages designed
- New product pages developed
- New products launched on website (end)
Next, she thinks through the tasks that move Project Couch forward from milestone to milestone.
- Create an outline of requirements
- Design product pages
- Complete product photography
- Build new product pages in the correct digital catalog
- Get QA approval to publish
2. Put tasks in order
To figure out how long your project will take, put your milestones and tasks in order.
The sequence of your project tasks might not be a straight line. Identify which are dependent and which are non-dependent.
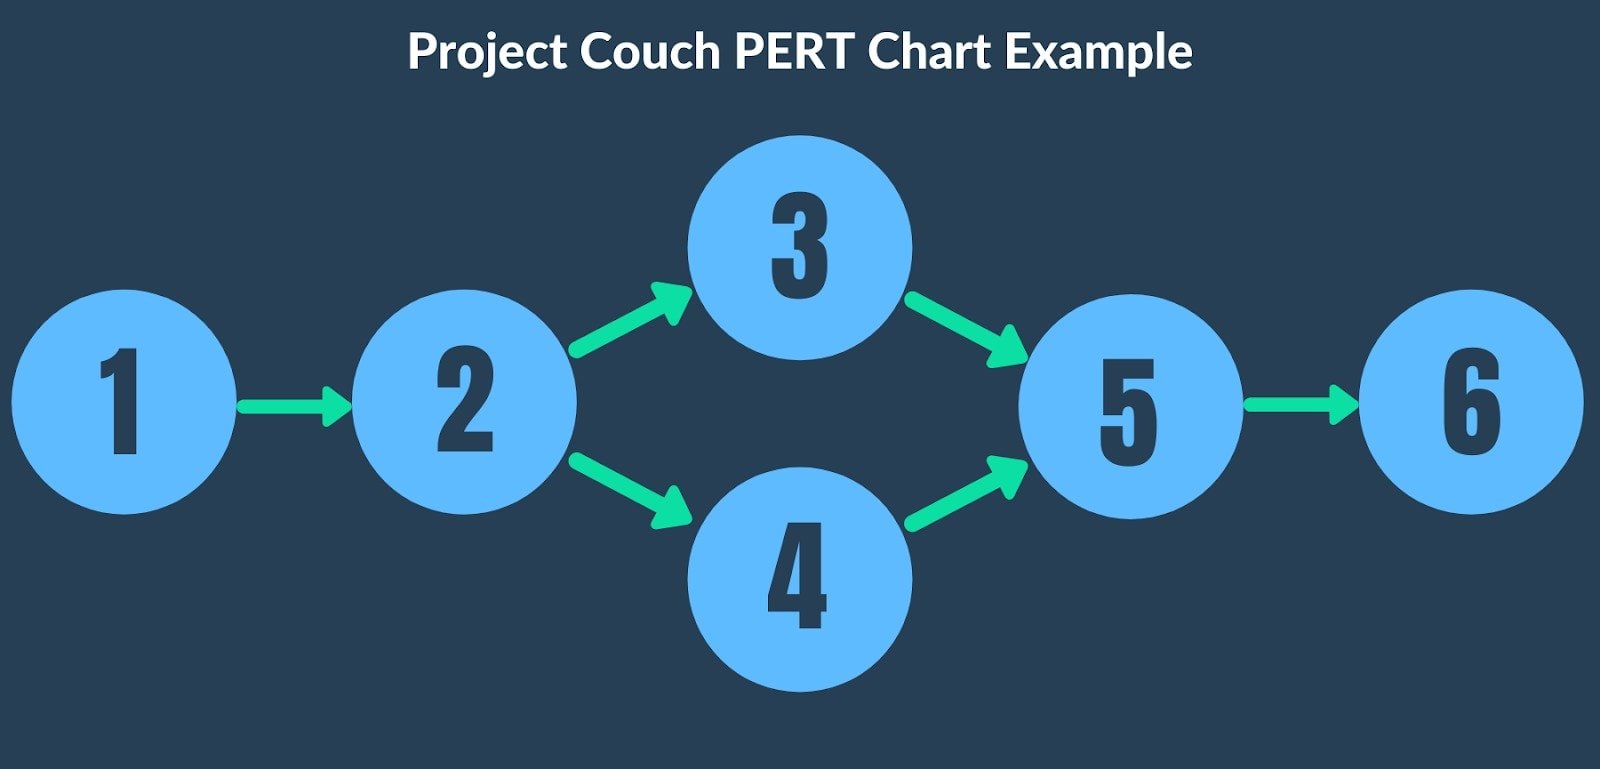
Let’s check in with Deenah. She places each task in chronological order and identifies which are dependent and non-dependent.
For Project Couch, events 3 and 4 are non-dependent. They can happen at the same time as long as event 2 is done. Event 5 is dependent on both events 3 and 4, so it can only happen when both are done.
In other words, Deenah can send work to the designer and photographer at the same time, but the product pages can’t be developed until the design and photography are both finished.
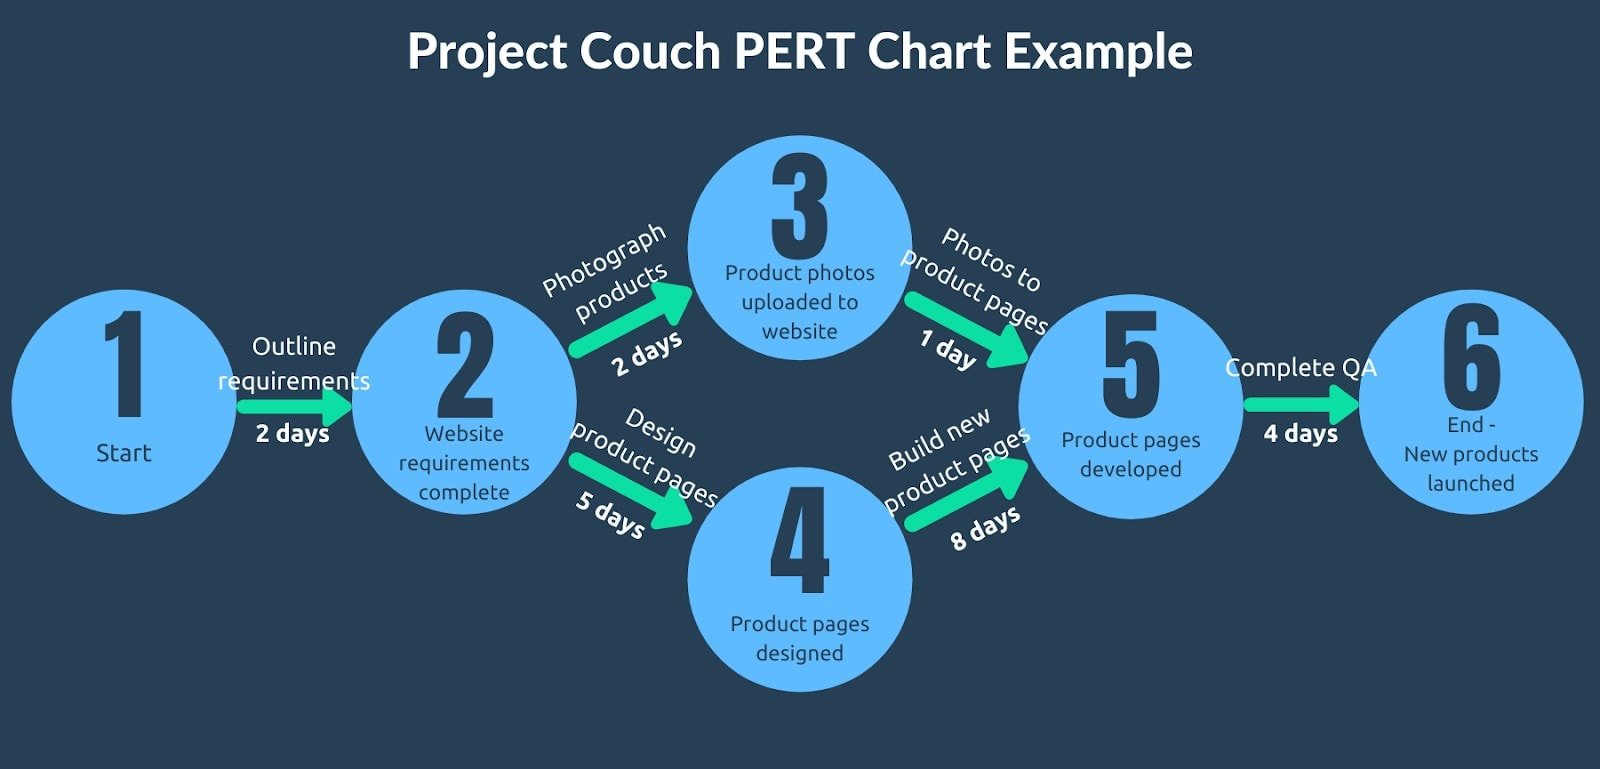
3. Create the diagram
Place the beginning, end, and all milestones in circular nodes. Event 1 is the beginning of the project and the last node is the project launch. Add arrows between nodes.
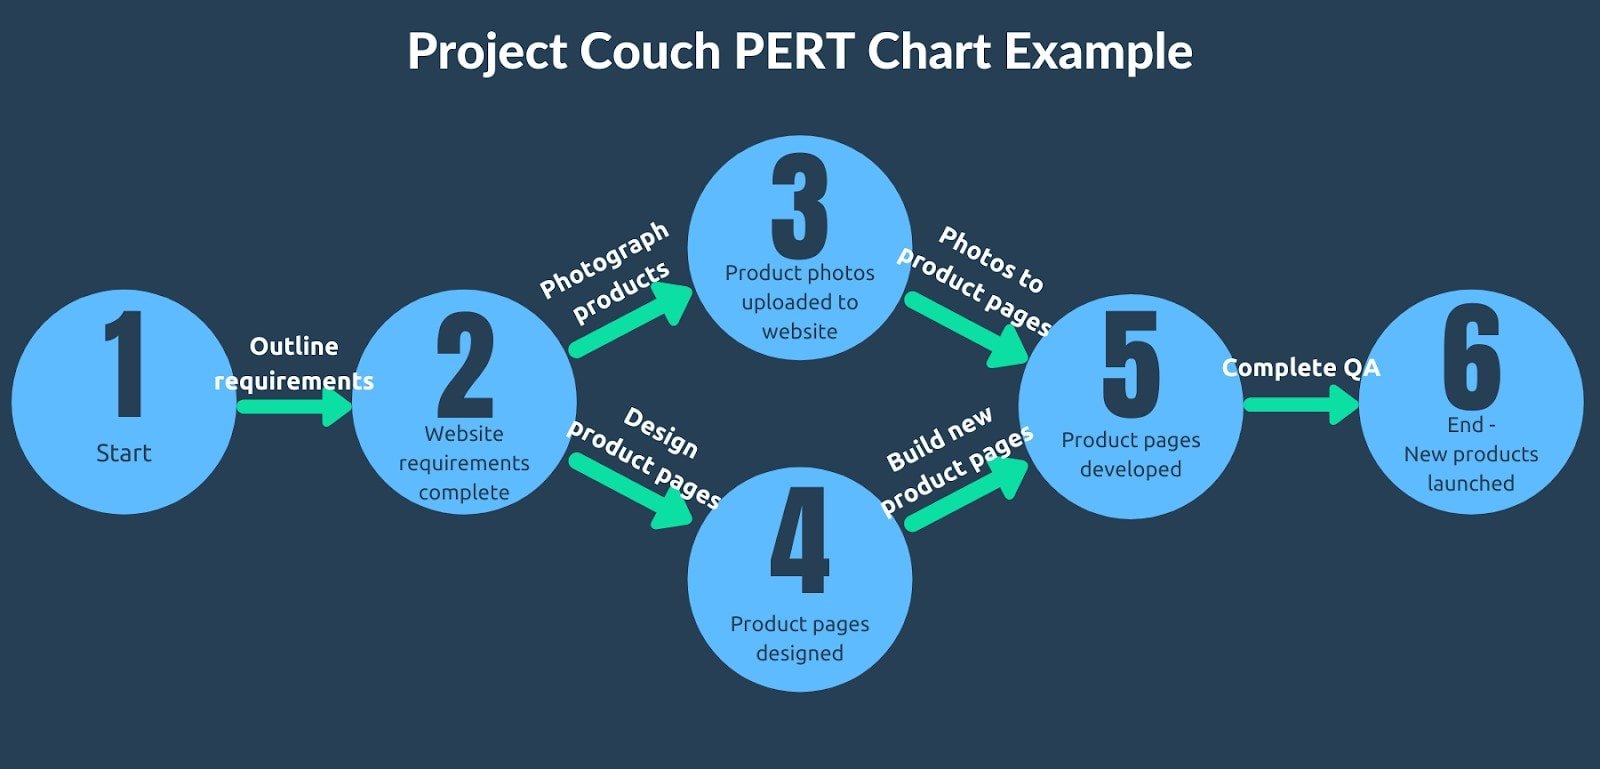
Above the arrows between nodes, write the tasks that must be completed to move from one milestone to the next.
If you’re familiar with an activity-on-arrow diagram, this is very similar. The action goes on the arrow between nodes and shows how they are dependent on each other.
Now, Deenah’s chart for Project Couch looks like this:
4. Calculate expected time
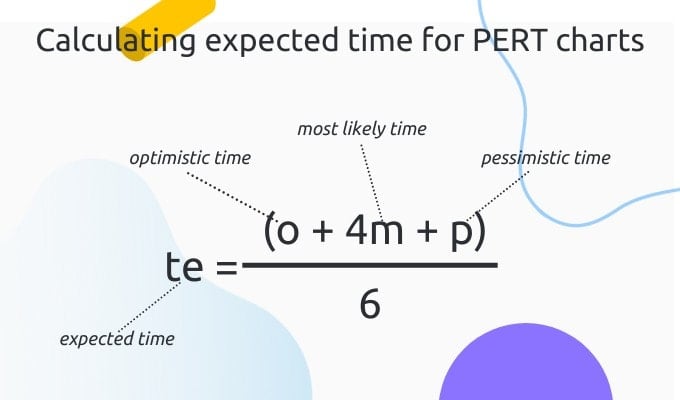
Create a time estimate for each task using the 3 types of PERT estimates: optimistic (o), pessimistic (p), and most Likely (m). You’ll use these to calculate expected time (te).
Here’s what that means:
Optimistic time (o) is the shortest amount of time to finish an activity. If everything goes right and your team works at peak productivity, how long will it take?
Pessimistic time (p) is the longest amount of time to finish an activity. If everything goes wrong, how long will it take?
Most likely time (m) is the strongest estimate of how long it will take to finish an activity if no problems come up. This should be between your optimistic and pessimistic estimates.
Expected time (te) is a weighted average of your first three times estimates. It leans strongly towards the most likely time, but takes into account that some parts of your project will go smoothly and others will likely encounter some problems.
Calculate expected time using this formula: te = (o + 4m + p) ÷ 6
If you’re not sure how to figure out your optimistic, pessimistic, and most likely times, talk to your team. Their experience is one of the best resources you have.
Calculate your expected time for each task and add that beneath the arrows on your PERT chart.
Here’s what Deenah’s chart looks like with the expected time added:
5. Identify the critical path and slack
The critical path is the longest timeline for your project. Slack is the extra time you have to complete tasks because other non-dependent tasks are expected to take longer.
To find the critical path and slack for Project Couch, Deenah highlights the longest estimates between each node. This shows her overall critical path and the greatest amount of time she needs for the entire project — 19 days.
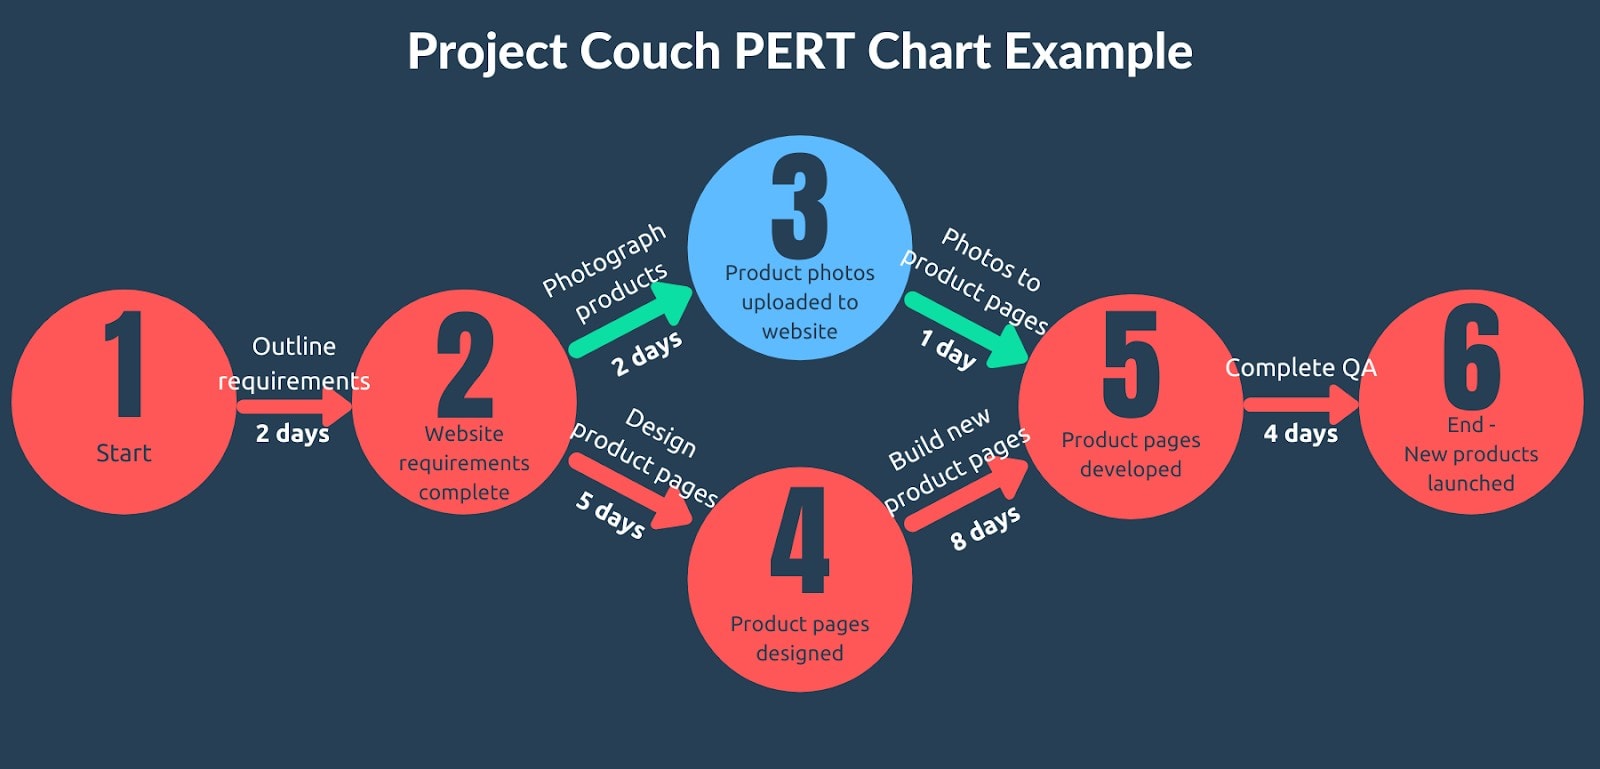
This process also shows her slack, which means tasks with more wiggle room.
The photographer only needs two days to get her work done between events 2 and 3, but the designer needs five days between events 2 and 4 on the critical path. The photography task has three days of slack. While the photographer can be a few days late without impacting project delivery, the designer must be on time.
6. Update as needed
No project management technique is perfect. Things always come up, and you must be able to adjust.
Update your PERT chart as your project progresses. Otherwise, you’ll look back at it halfway through and realize it’s no longer accurate or useful.
Deenah’s PERT chart is a living document. If there are delays or other changes, Deenah adjusts it and calculates the new expected delivery date.
By keeping the PERT chart up to date, it remains valuable throughout the project.
She presents it to stakeholders to show progress and explain why and how adjustments were made. It also helps Deenah stay focused on the parts of the project where there’s the most risk for delay.
Advantages and disadvantages
PERT charts are great for a lot of projects, but like all project management methods, they’re not perfect.
Here are some advantages of using PERT charts to manage projects:
Easily visualize your project timeline
One of the main advantages of PERT is how it allows you to see an entire project in a clear and simple format.
At a glance, you can see how project components fit together, who needs to be involved when, and where you’re most likely to encounter delays.
Avoid delays due to prioritization errors
Since you can see where you do and don’t have slack, you can keep the project on track by focusing your efforts on the critical path where they make the most difference.
A delay in an area where you have a few days of slack isn’t as problematic as a delay along your critical path. You can spend less of your focus keeping non-critical tasks on time.
Communicate delays to stakeholders more clearly
If you do encounter a problem along your critical path, your PERT chart makes it much easier to show what went wrong and why it had such an impact.
You can also identify and communicate problems much sooner so that everyone can adjust their expectations early.
Here are a couple of downsides:
Too much emphasis on critical path
While delays in tasks where you have slack are less likely to push your project off course, ignoring those problems altogether can derail your timeline.
Focusing too closely on the critical path can cause you to miss things. Be careful not to overlook other project needs.
Poor estimates cause inaccurate timelines
The process of calculating expected time is designed to help minimize inaccuracies in your timeline.
That calculation is only as good as its inputs, though. Expected time is calculated based on your (or your team’s) estimates. If those estimates are off, so is your timeline.
Dependent tasks are difficult to change
Since your milestones are dependent on the tasks in front of them, changing things in the middle of a project is hard. Major changes might send you back to the drawing board.
PERT charts are designed to estimate and adjust to changes in time, but aren’t great if you need to change tasks or milestones.
This is more problematic for projects that need to be highly flexible. PERT charts need to be reworked every time you add, change, or remove a node. For a project with changing needs, this adds more complexity.
Technology makes PERT charts more effective
A PERT chart is like a basic roadmap. The information is all there, but it’s up to you to figure out where you need to go. It’s not going to give you turn-by-turn directions like a GPS does.
They make it easy to see the big picture. Technology turns that picture into something you can actually act on, like your GPS giving you directions while you drive.
Your tech tools should do a lot more than just create a nice looking chart. You also need to know:
- Is each task on time?
- Who is responsible for each action item?
- What issues are slowing your team down?
- Do you have as much slack as you think?
Pair your PERT chart with a great task management software like Hubstaff Tasks. You’ll find it much easier to assign tasks to the right people, track progress, and identify potential delays earlier. You’ll also adapt to change more effectively and spend less time in meetings.
Final thoughts
Using a PERT chart is a smart way to plan and manage a project.
To get the most value from it, you should maintain it throughout the project. Using a task management tool makes the information on your PERT chart actionable so that your team can work on the right things at the right times.
Are you going to use a PERT chart to plan your next project? Why or why not? Tell us what you’re working on in the comments.
Subscribe to the Hubstaff blog for more posts like this
Most popular
How to Spot and Manage Work Overload Before Your Best People Burn Out
Work overload occurs when the demands placed on an employee or team exceed their available resources, leading to stress, burnout,...
Workplace Productivity Statistics in 2026: What the Numbers Say
For many businesses, having the ability to maximize output without compromising quality gives them a major edge over their competi...
Time Doctor vs. ActivTrak: Which Tool Is Right for Your Team?
Time Doctor and ActivTrak are two of the most powerful and popular time tracking solutions. Both have strong features, and both ca...
Work-Life Balance Statistics in 2026: A Global Perspective
Work-life balance has become a deciding factor in how people, especially Gen Z, choose or leave jobs. The data shows that work-lif...


![How to Identify, Define and Prioritize Business Goals in A Startup [Examples]](https://hubstaff.com/blog/wp-content/uploads/2019/04/Goals-and-Task@2x-780x390.jpg)